Py4CAtS --- Python for Computational ATmospheric Spectroscopy
[Image: DLR]
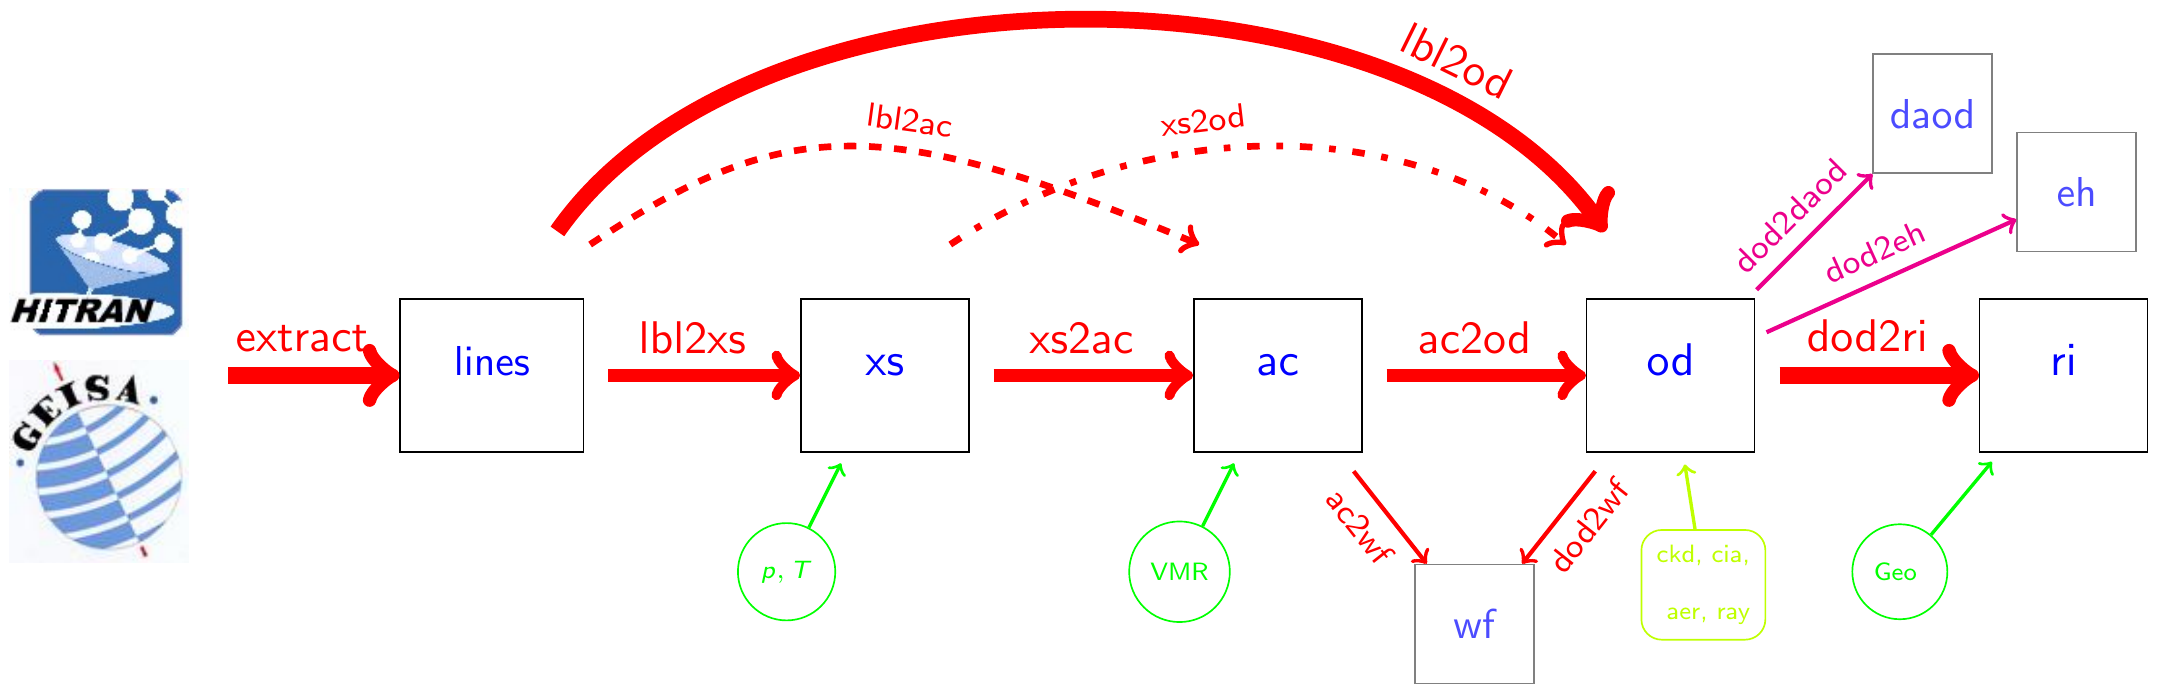
Main Scripts/Functions: From Hitran/Geisa to cross sections to optical depths and radiance (intensity)
- higstract
- HItran-GeiSa extract (select) lines of (a) certain molecule(s) (and isotope) and/or wavenumber range from
line parameter database
- lbl2xs
- line-by-line (lbl) cross sections for some molecule(s) and some p, T
- lbl2od
- computation of line-by-line optical depth due to molecular absorption (combines lbl2xs, xs2ac, ac2od)
- (d)od2ri
- Given the (layer, delta) line-by-line optical depth solve Schwarzschild equation to radiation intensity
Installation: Getting started with Py4CAtS
Download the wheel file and execute the following command:
pip install py4cats-4.0.0-py3-none-any.whl
The command installs Py4CAtS in your current Python environment (four subdirectories art,
var, lbl, and inv).
Prerequisites: Python (>=3.10) and numpy
(sometimes scipy and matplotlib for
plotting) but the pip installer should take care of dependencies.
OLD: Download a tarball of Python sources, some data files, and the
documentation and
unpack it at some convenient place:
tar xfvz py4cats.tgz
The top-level directory py4cats includes a 1.ReadMe file with basic
instructions,
and six subdirectories bin, data, doc, art,
var, and lbl.
Usage
Py4CAtS can be used in two ways, from inside the (I)Python interpreter
or Jupyter Qt Console or Notebook (see the demo or
the poster for the ASA-HITRAN 2016 congress) or from the Unix/Linux (or
Windows/Mac?) console/terminal.
or
the poster for the ASA-HITRAN 2016 congress) or from the Unix/Linux (or
Windows/Mac?) console/terminal.
In an (I)Python shell the package becomes available for the Python interpreter after one of the following import
statements:
import py4cats
from py4cats import *
If you also want to use Py4CAtS from the console/terminal you need to create a ./bin directory
beside the ./lbl, ./art, ./var directories.
Next execute the following (t)csh command in the current directory to create links for all executable
scripts/modules:
foreach file ( `grep -l '/usr/bin/env python' {art,var,lbl}/*.py` )
if ( -x $file ) ln -s ../$file bin/$file:r:t
end
Data and  Documentation
To play around, download the tarball which contains data files and the
documentation.
Unpack it with the command tar xfvz data_and_doc.tgz at some convenient place.
And you need some line data (HITRAN and/or GEISA).
For the beginning, here is a thermal infrared excerpt of
Hitran 86.
For a detailed review of line-by-line modeling for infrared radiative transfer see the manual
py4cats.pdf
in the doc directory.
Sections 5 and 6 describe Py4CAtS' usage from the Unix/Linux shell and the (i)python shell, respectively.
How to cite Py4CAtS?
- F. Schreier, S. Gimeno García, P. Hochstaffl and S. Städt.
Py4CAtS --- Python for Computational ATmospheric Spectroscopy.
Atmosphere 10(5), 262, 2019, doi:
10.3390/atmos10050262
-
F. Schreier and S. Gimeno Garcia.
Py4CAtS – Python Tools for Line-by-Line Modelling of Atmospheric Radiative Transfer.
In Robert F. Cahalan and Jürgen Fischer (editors),
Radiation Processes in the Atmosphere and Ocean (IRS 2012): Proceedings of the International
Radiation Symposium (IRC/IAMAS)
Volume 1531 of AIP Conference Proceedings, pages 123 - 126.
American Institute of Physics, 2013. doi:
10.1063/1.4804723
-
F. Schreier and P. Hochstaffl.
Py4CAtS --- Python for Computational ATmospheric Spectroscopy.
GSICS Quarterly 13(4), pp. 6 - 8, 2020, doi:
10.25923/ymt5-wz59
- See also GARLIC (Generic Atmospheric
Radiation Line-by-line Infrared Code, Py4CAtS' big brother): JQSRT 137, 29-50, 2014,
doi: 10.1016/j.jqsrt.2013.11.018,
and our related projects lbl4IR
(download BiBTeX entries)
-
October 2024 (v4.0, wheel-file)
- Added directory inv containing modules for inversion
- Modules sveeeeties, chahine, tools, lidar,
varpro, birra
-
July 2024 (v3.4, wheel-file)
- Module art.radInt:
- riArray attribute names refined
- Module art.oDepth:
- odInfo expanded for list of optical depths (i.e. add info for sum)
- New function sum_column (used by expanded odInfo and dod2tod)
Spring/Summer 2024 (v3.3, wheel-file)
Line-wing cut-off enabled by default
Module lbl2xs
Line-wing cut-off added and enabled by default - causes slightly different molecular cross!
Cut-off improves modeled spectra, particularly in areas with significant differences in neighboring line
strengths, e.g., around 2400 cm-1.
For a more detailed discussion see Gharib-Nezhad et al.
-
Summer 2023 (v3.1, wheel-file)
- Source code now delivered as a Python .whl file
Details see Installation instructions above
-
December 2023 (v3.2, wheel-file)
- Spherical geometry
- Modules art/od2ri.py, art/wgtFct.py, art/cia.py
lbl/lbl2od.py
- Spherical geometry if radius is provided (default plane-parallel radiative transfer)
-
March 2021
- Source code now reorganized as a package
- Source files are now distributed over three subdirectories
- lbl: modules related to lbl computations incl. Hitran/Geisa database access,
Voigt routines etc.;
- art: modules related to atmospheric radiative transfer;
- var: auxiliary modules that should/could be useful in any context, e.g.
input/output routines.
The setup module py4cats.py is not required anymore, import of the Py4CAtS module is now
organized by the __init__.py files.
-
Spring - Summer 2021 (see What's new?
for a full listing)
- Plot functions
- atmPlot, acPlot, odPlot, riPlot, xsPlot functions have an additional argument **kwArgs
(passed thru to MatPlotLib's functions)
acPlot, odPlot, xsPlot with an additional argument xUnit (instead of flag mue or nm)
- Module var/aerosol.py
- new module for aerosol optical depth using simple power law (Angstrom coefficient)
- Modules lbl/lbl.py, lbl/lines.py, and lbl/lineshapes.py
- "beyond Voigt" line shapes and parameters
- Module art/limb.py:
- new module for limb (occultation) transmission and effective height
- Module art/od2ri.py
- completely rewritten with added support for surface reflection etc
- Module art/rayleigh.py
- new module for Rayleigh extinction
- Module lbl/sdr.py
- new module for speed-dependent Voigt and Rautian functions
-
Fall 2021 (see What's new? for a full
listing)
- Module lbl/lbl2od.py
- three new options for function lbl2od to add cia, Rayleigh, and aerosol extinction to absorption
coefficient(s) and optical depth(s)
-
Winter 2021/22 (see What's new? for a
full listing)
- Module art/atmos1D.py
- The function atmPlot can plot all molecular profiles simultaneously with a call
atmPlot(atmosData, what='*')
- Module art/radInt.py
- new class methods dict and append for riArray
- Modules lbl/lbl2ac.py and lbl/lbl2od.py
- In the corresponding functions a consistency test of atmospheric vs line data has been implemented: stop
if line data are given, but no corresponding concentrations
-
Spring/Summer 2022 (see What's new?
for a full listing)
- Module art/oDepth.py
- new function odSum: alternative implementation of dod2tod
- Module var/srf.py
- new response function gaussBox
© fgs (+49-8153-28-1234)
© plh (+49-8153-28-3056)
Fri Jun 28, 2024; 14:12
Imprint
Privacy Policy
Terms of Use
Accessibility