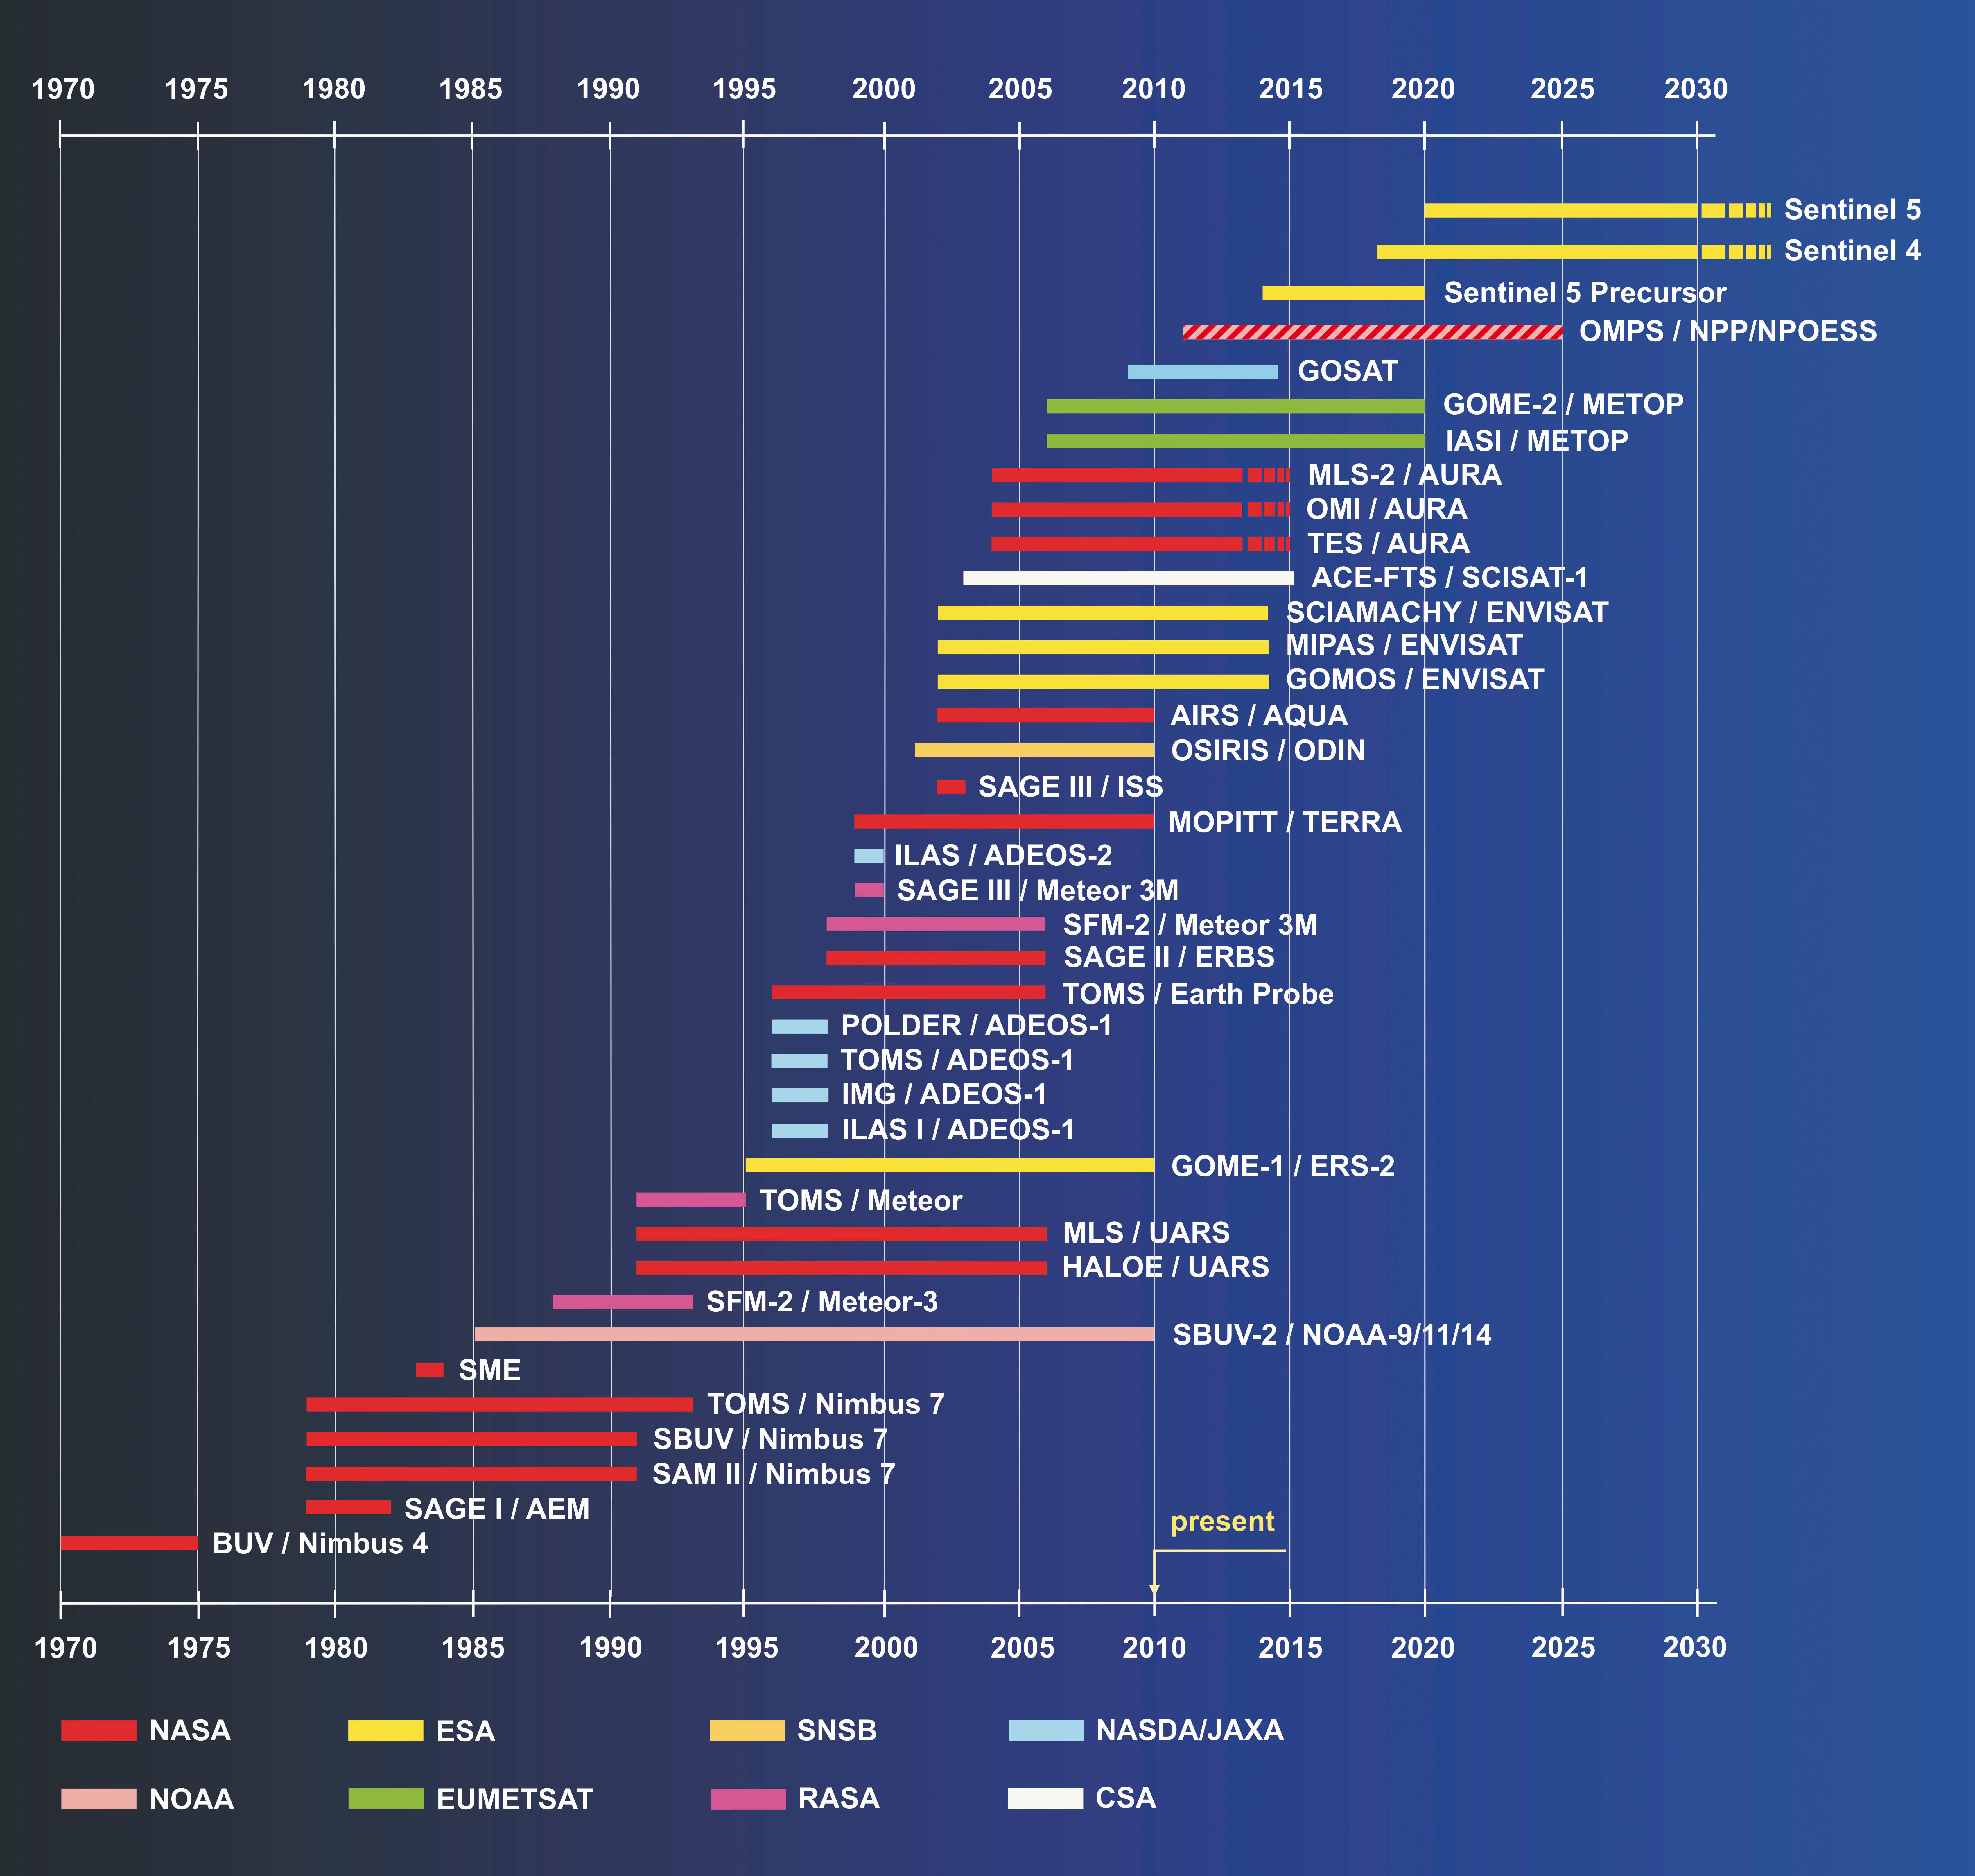
| Fig. 1-1 | Atmospheric science spaceborne instruments and missions since 1970
with relevance for SCIAMACHY. The list of missions is not intended to be complete but to illustrate the progress in spaceborne instrumentation for atmospheric composition monitoring.
(Courtesy: DLR-IMF) |
|
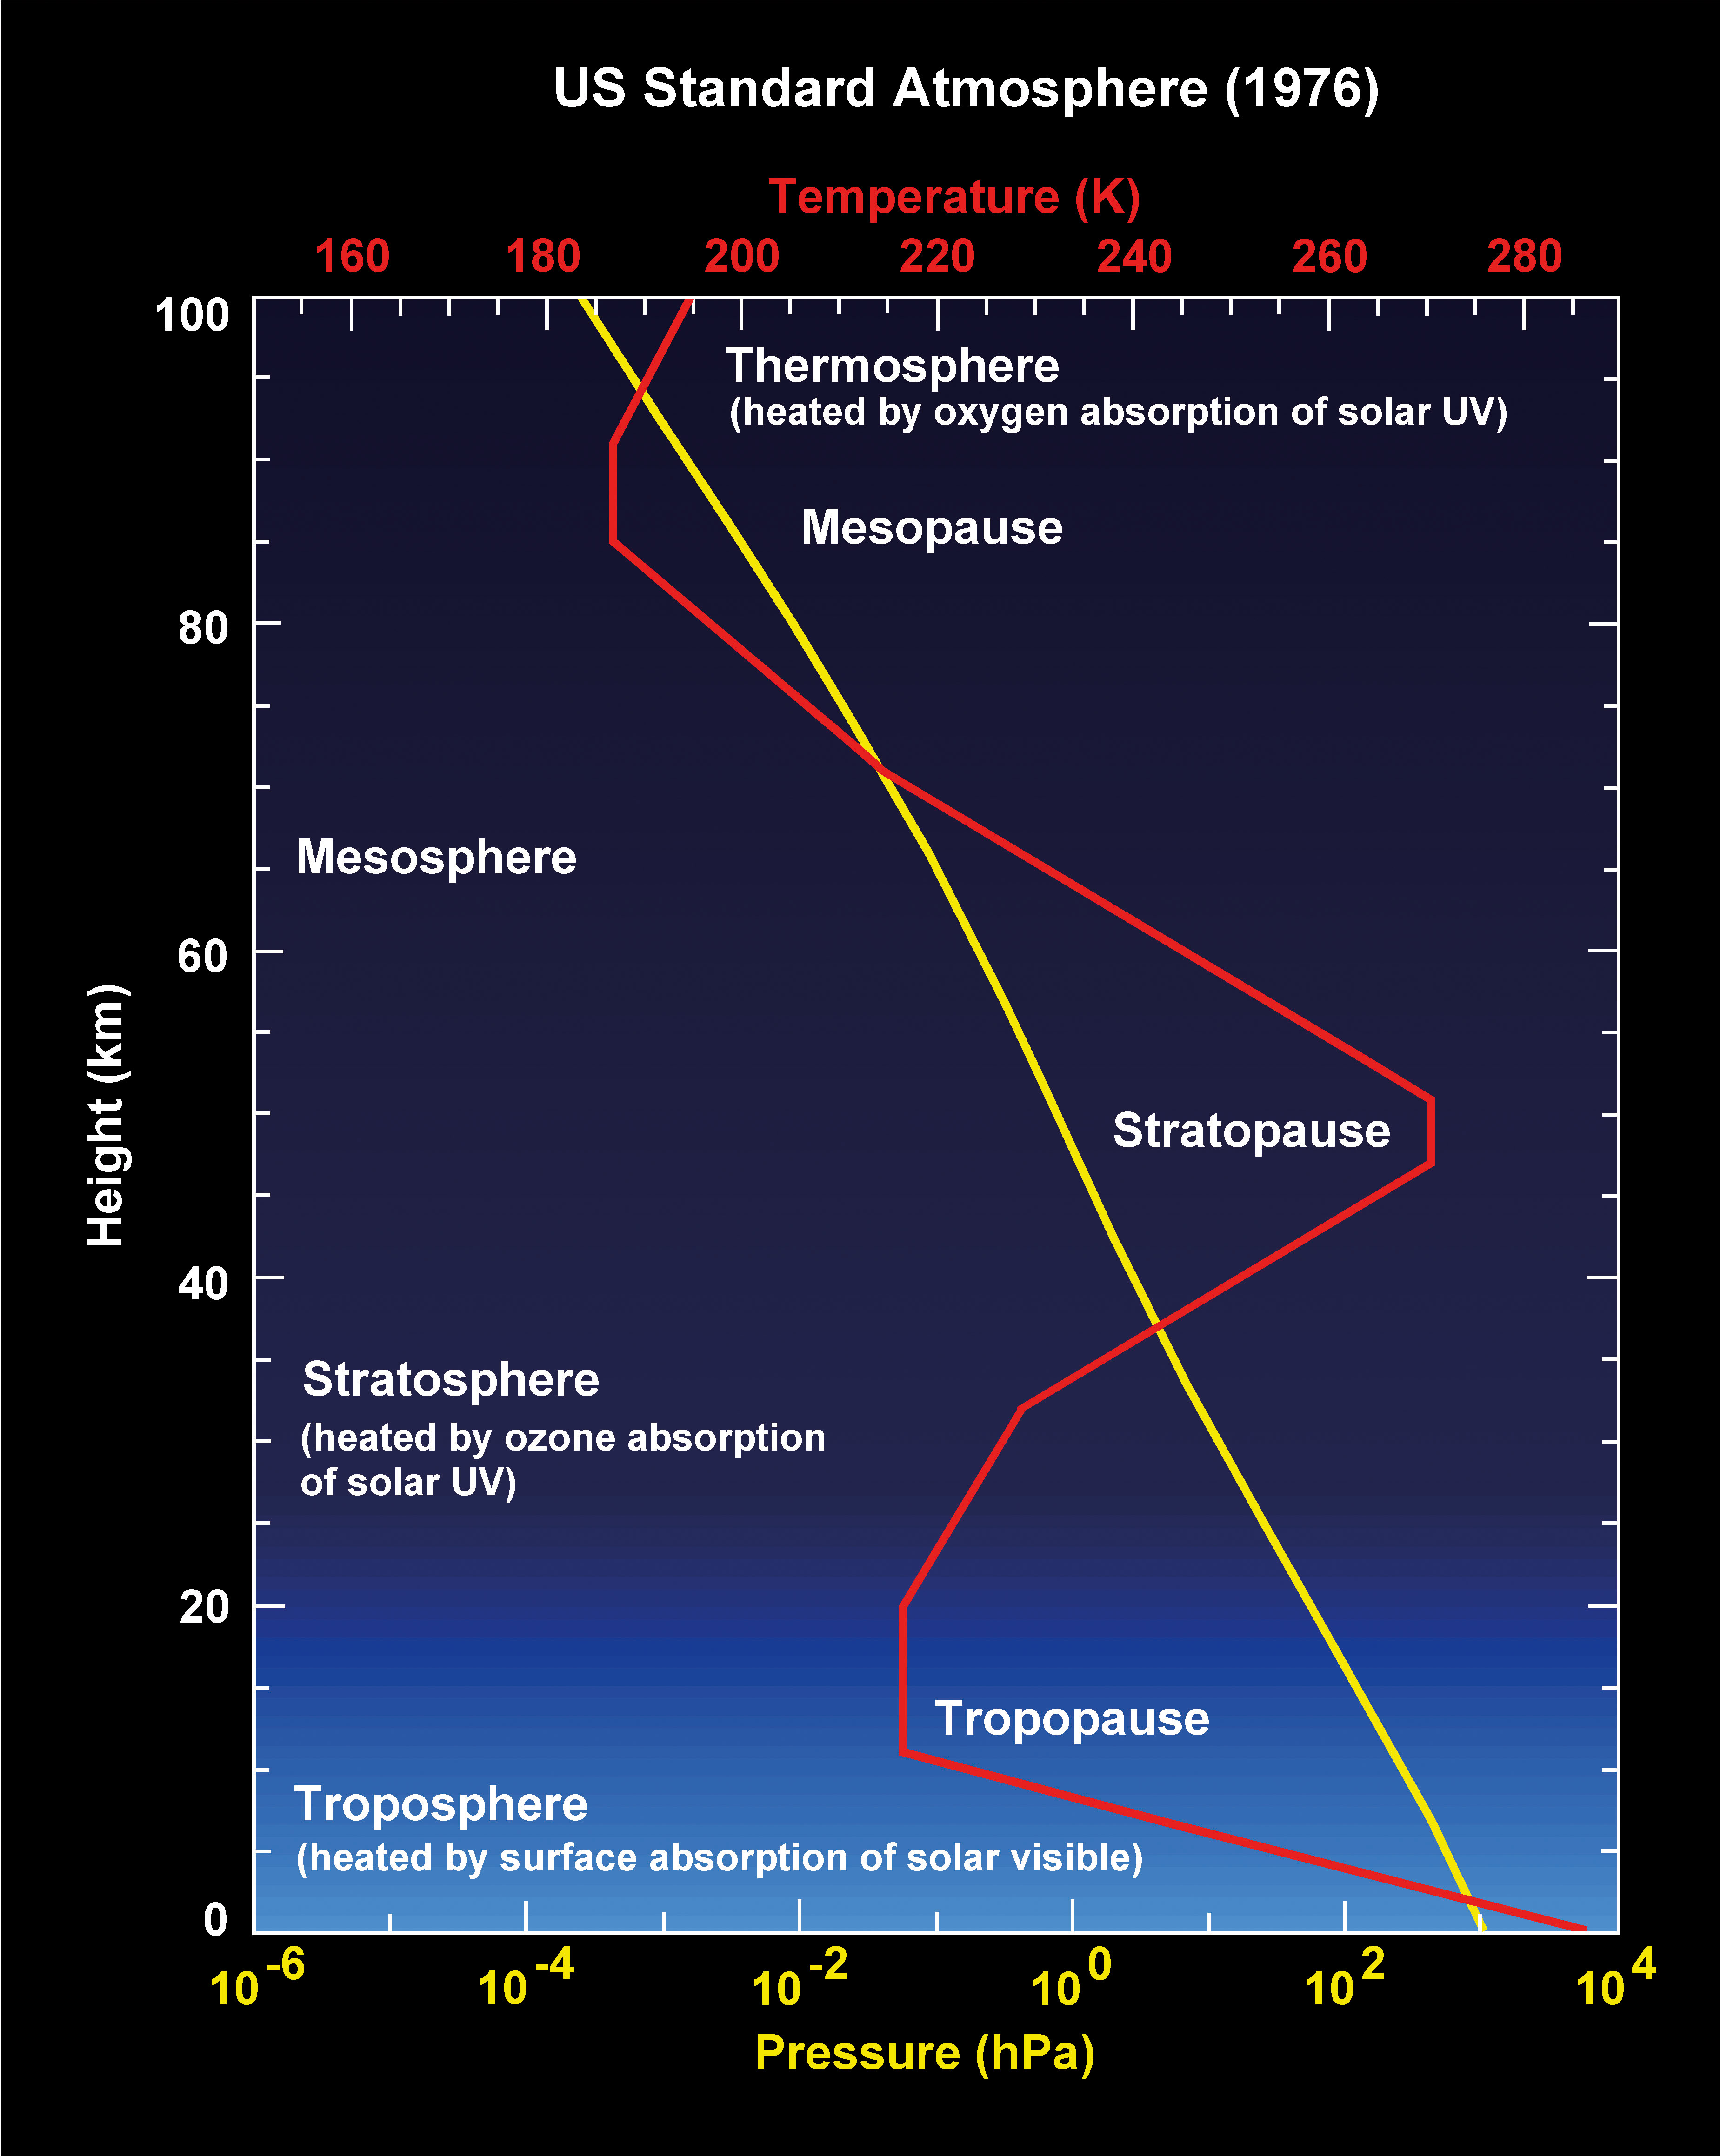
| Fig. 1-2 | Atmospheric pressure and temperature profiles for mid latitudes.
(US Standard Atmosphere).
|
|
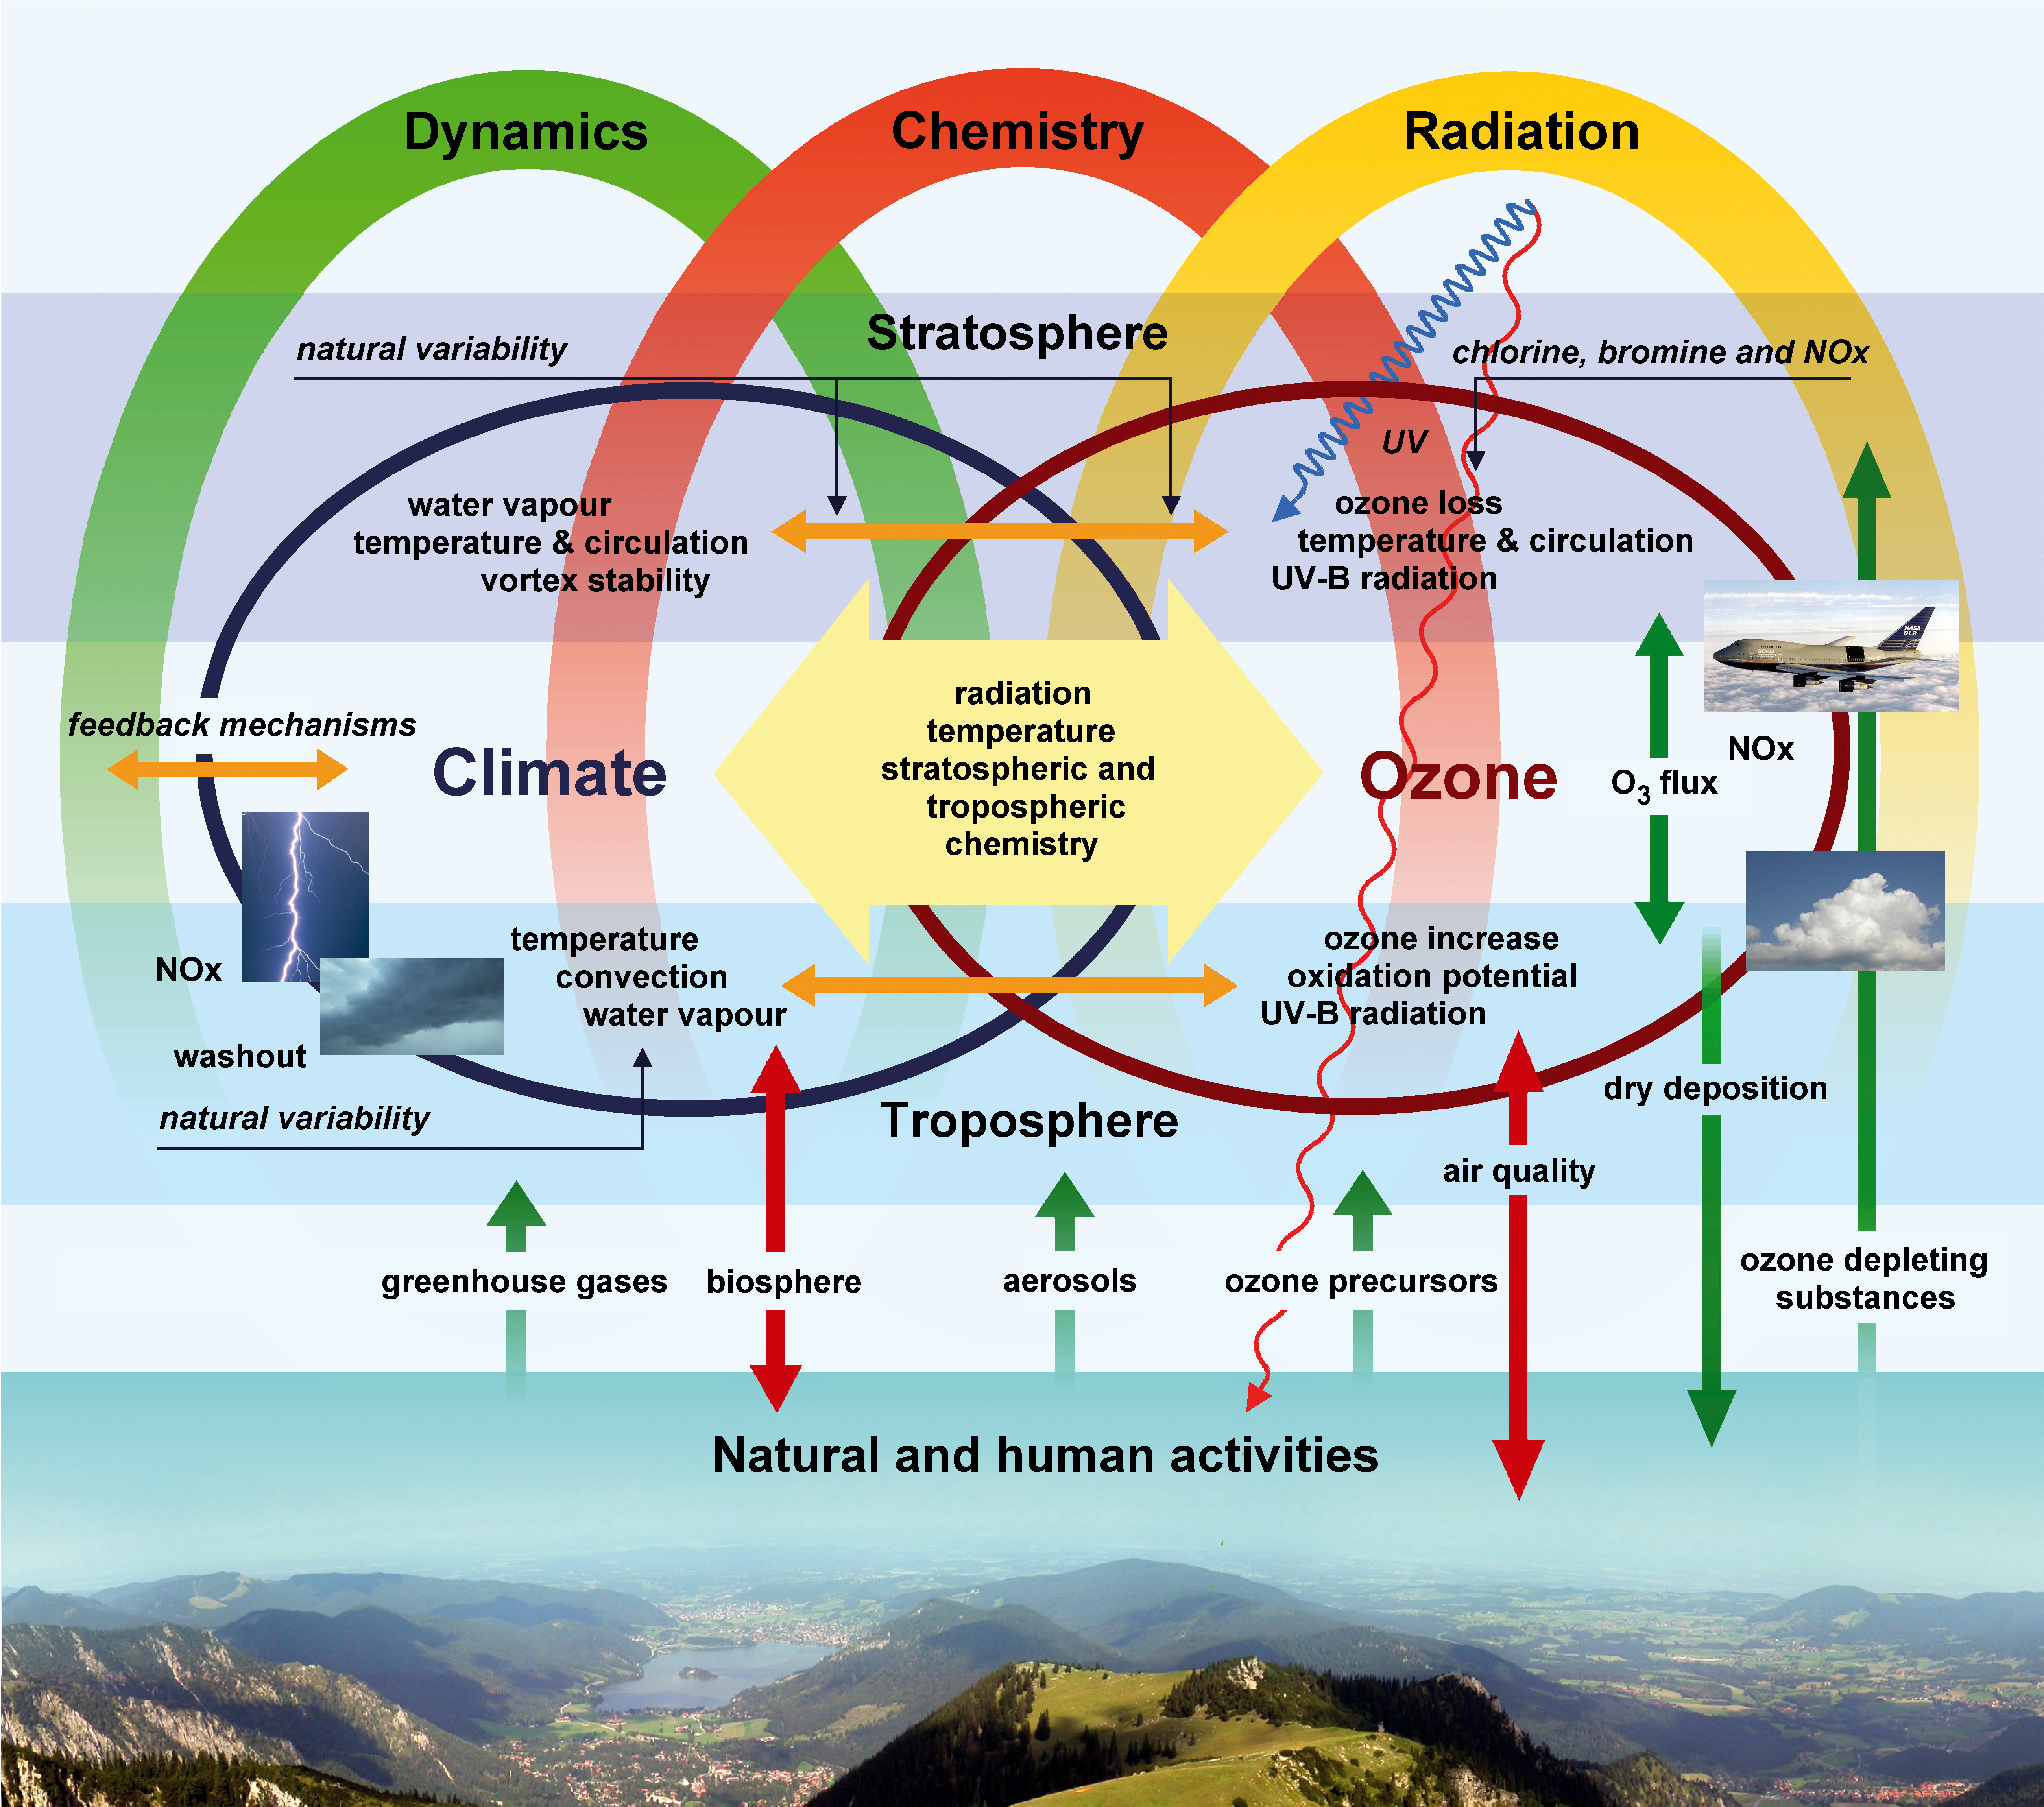
| Fig. 1-3 | Interactions between human activity, atmospheric composition, chemical and physical
processes and climate. (Courtesy: DLR-IMF, after IGACO 2004)
|
|
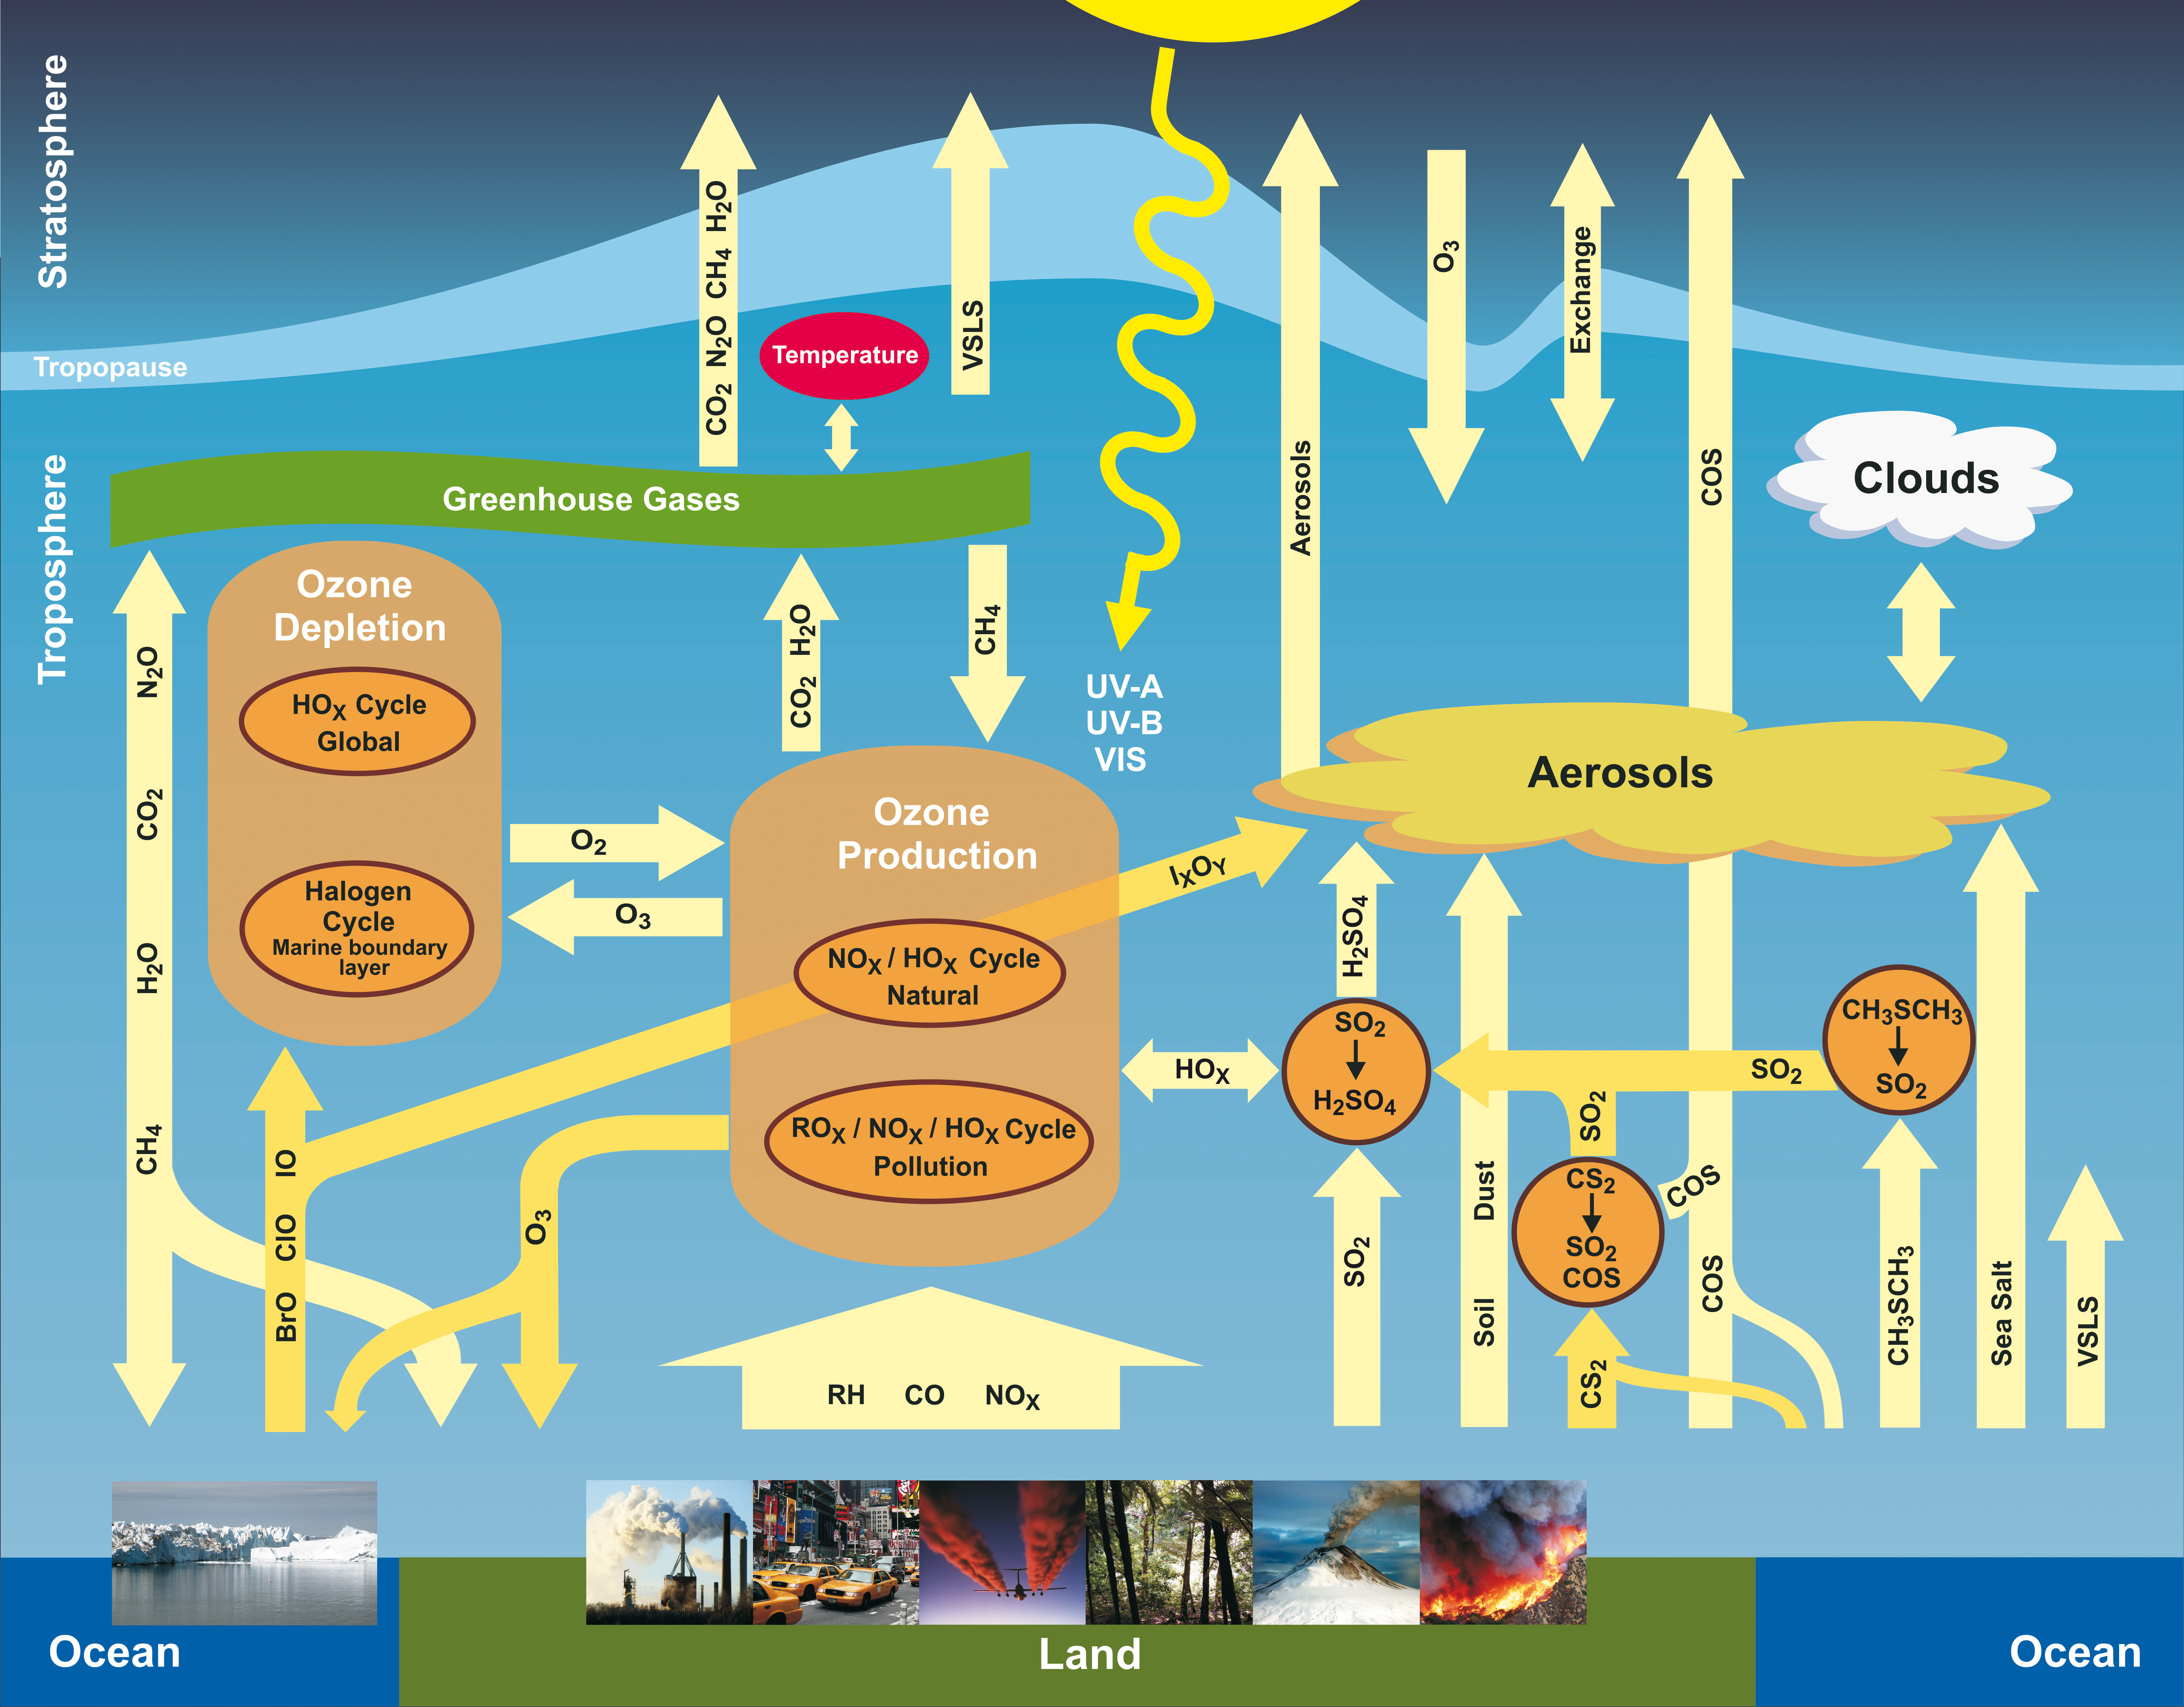
| Fig. 1-4 | The dominant physical and chemical processes determining the composition of the troposphere.
Courtesy: IUP-IFE, University of Bremen) |
|
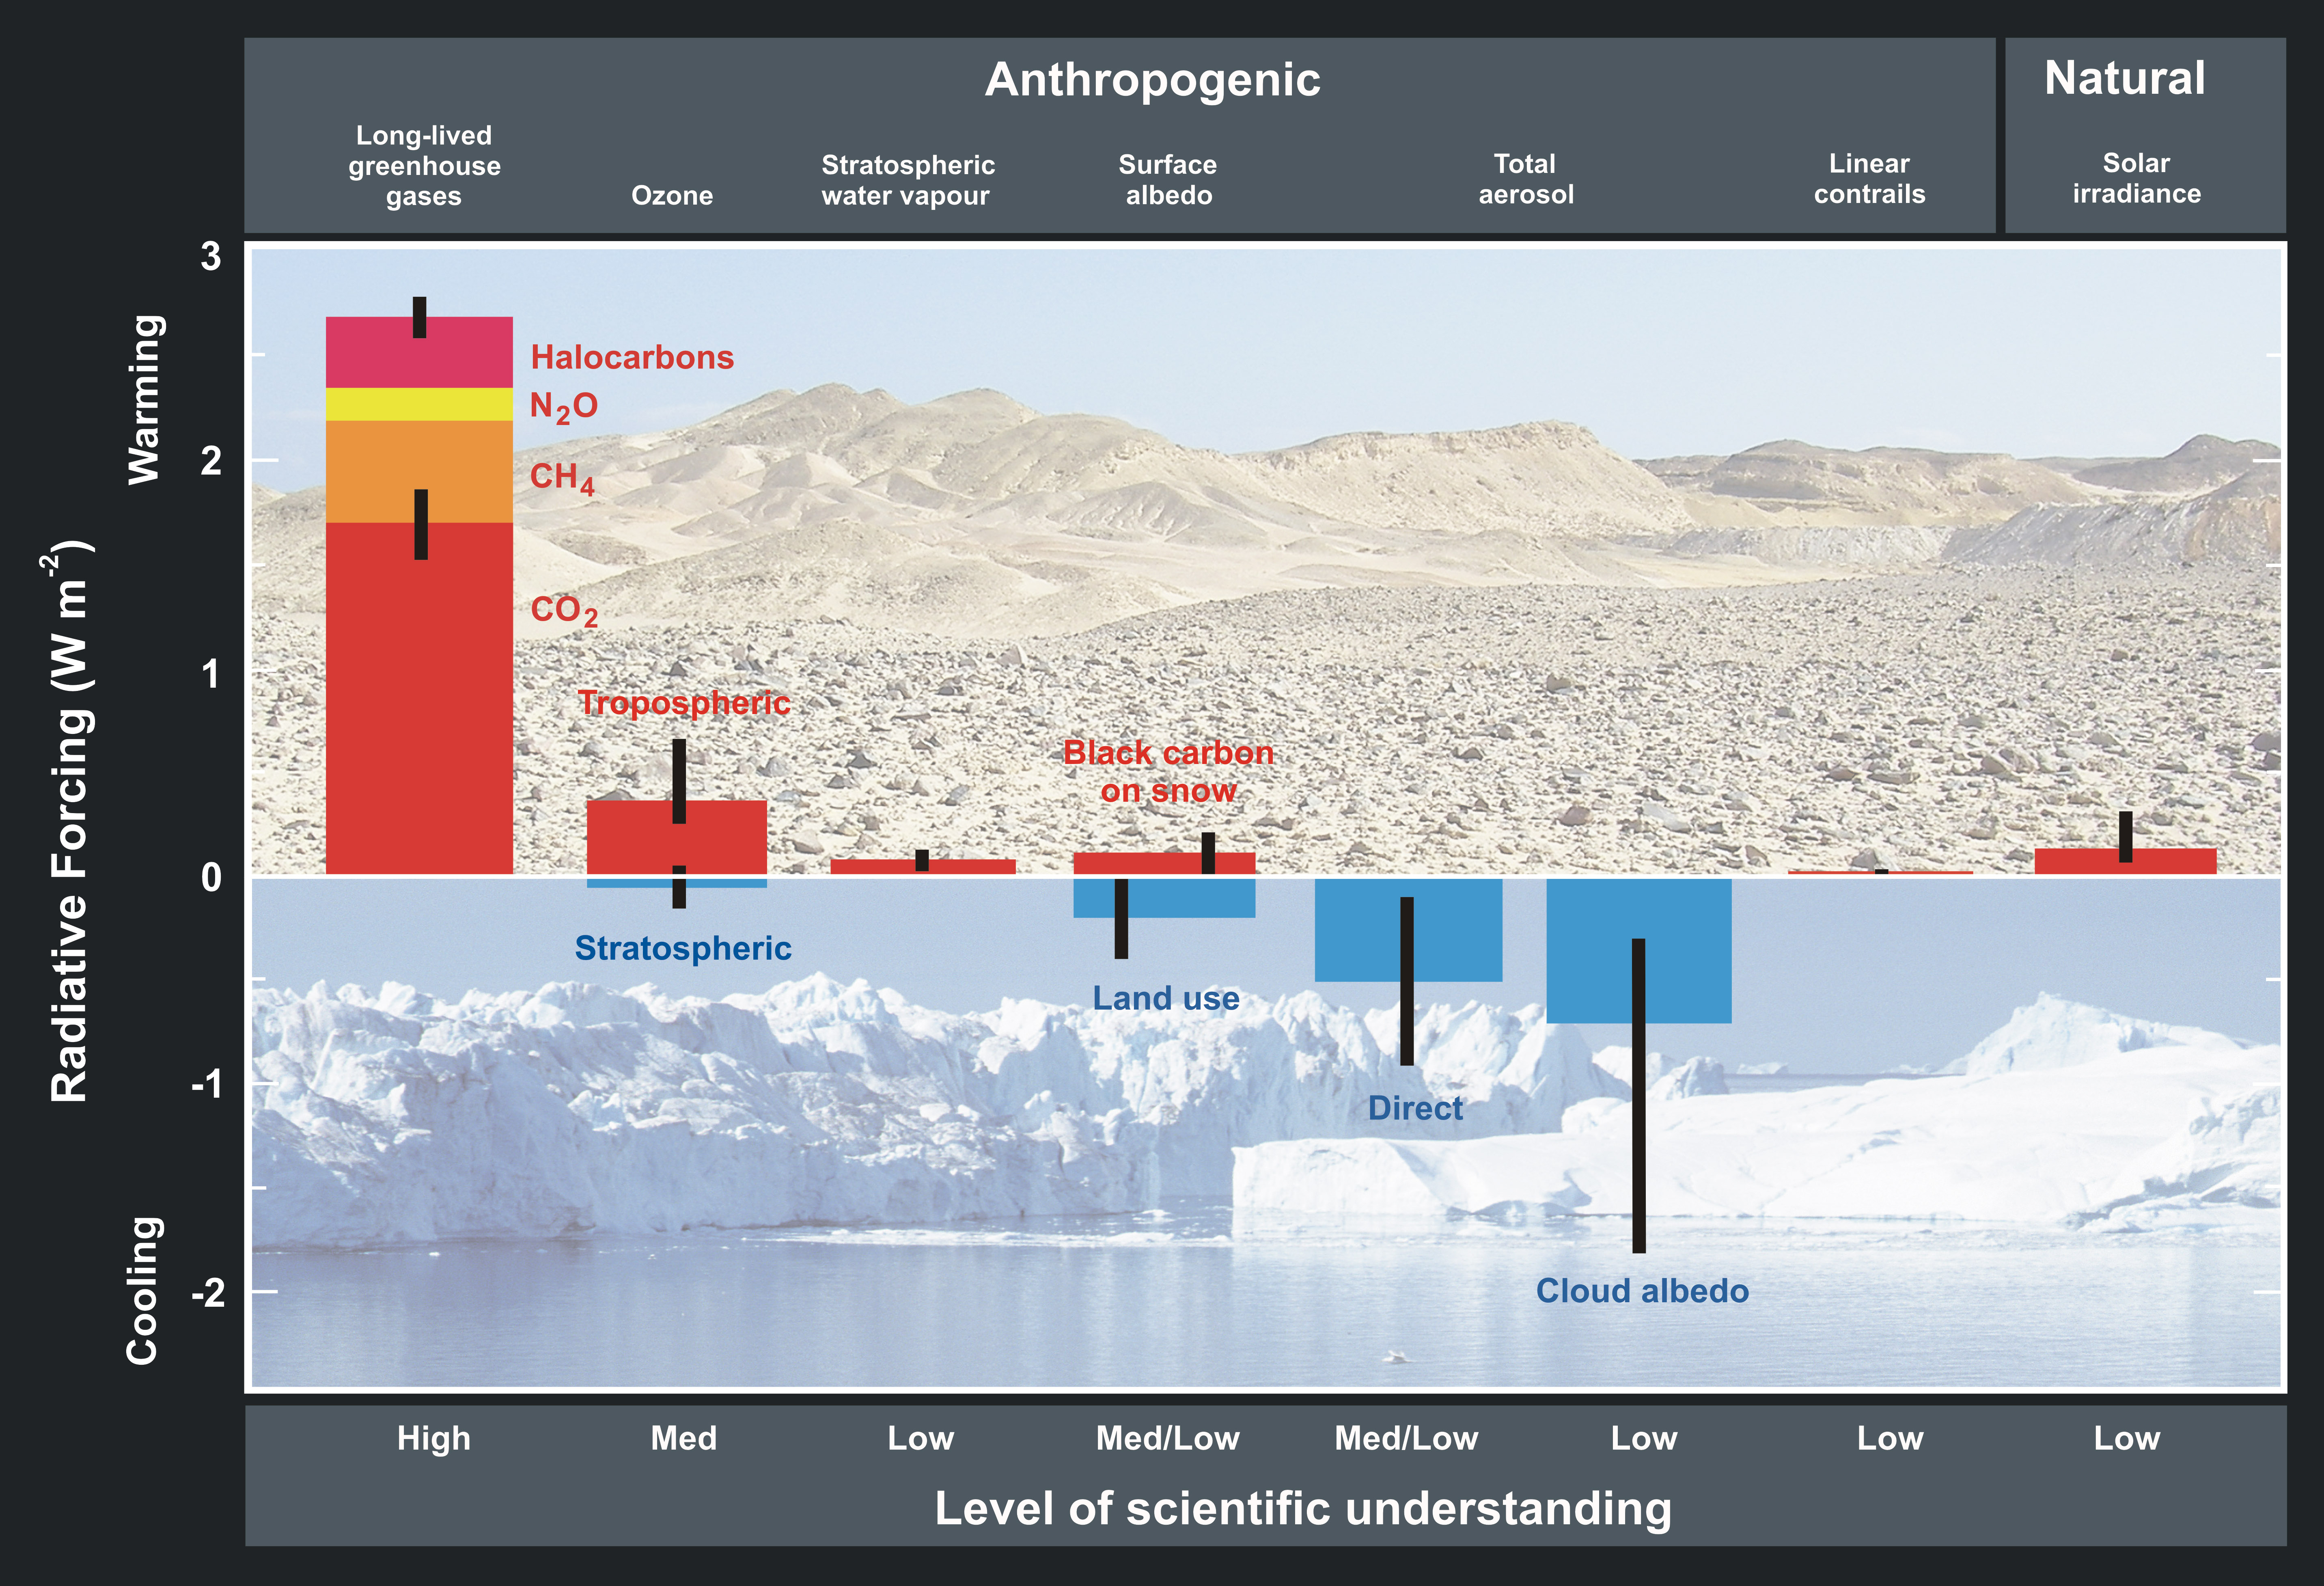
| Fig. 1-5 | Global,
annual mean radiative forcings (W/m2) due to a number of agents for the period from pre-industrial (1750) to present (2005). The
height of each box denotes a central or best estimate value. The vertical bars visualise an estimate of the uncertainty range,
for the most part guided by the spread in the published values of the forcing. A 'level of scientific understanding' index is
associated to each forcing, with high, medium and low levels, respectively. (Courtesy: adapted from IPCC 2007) |
|
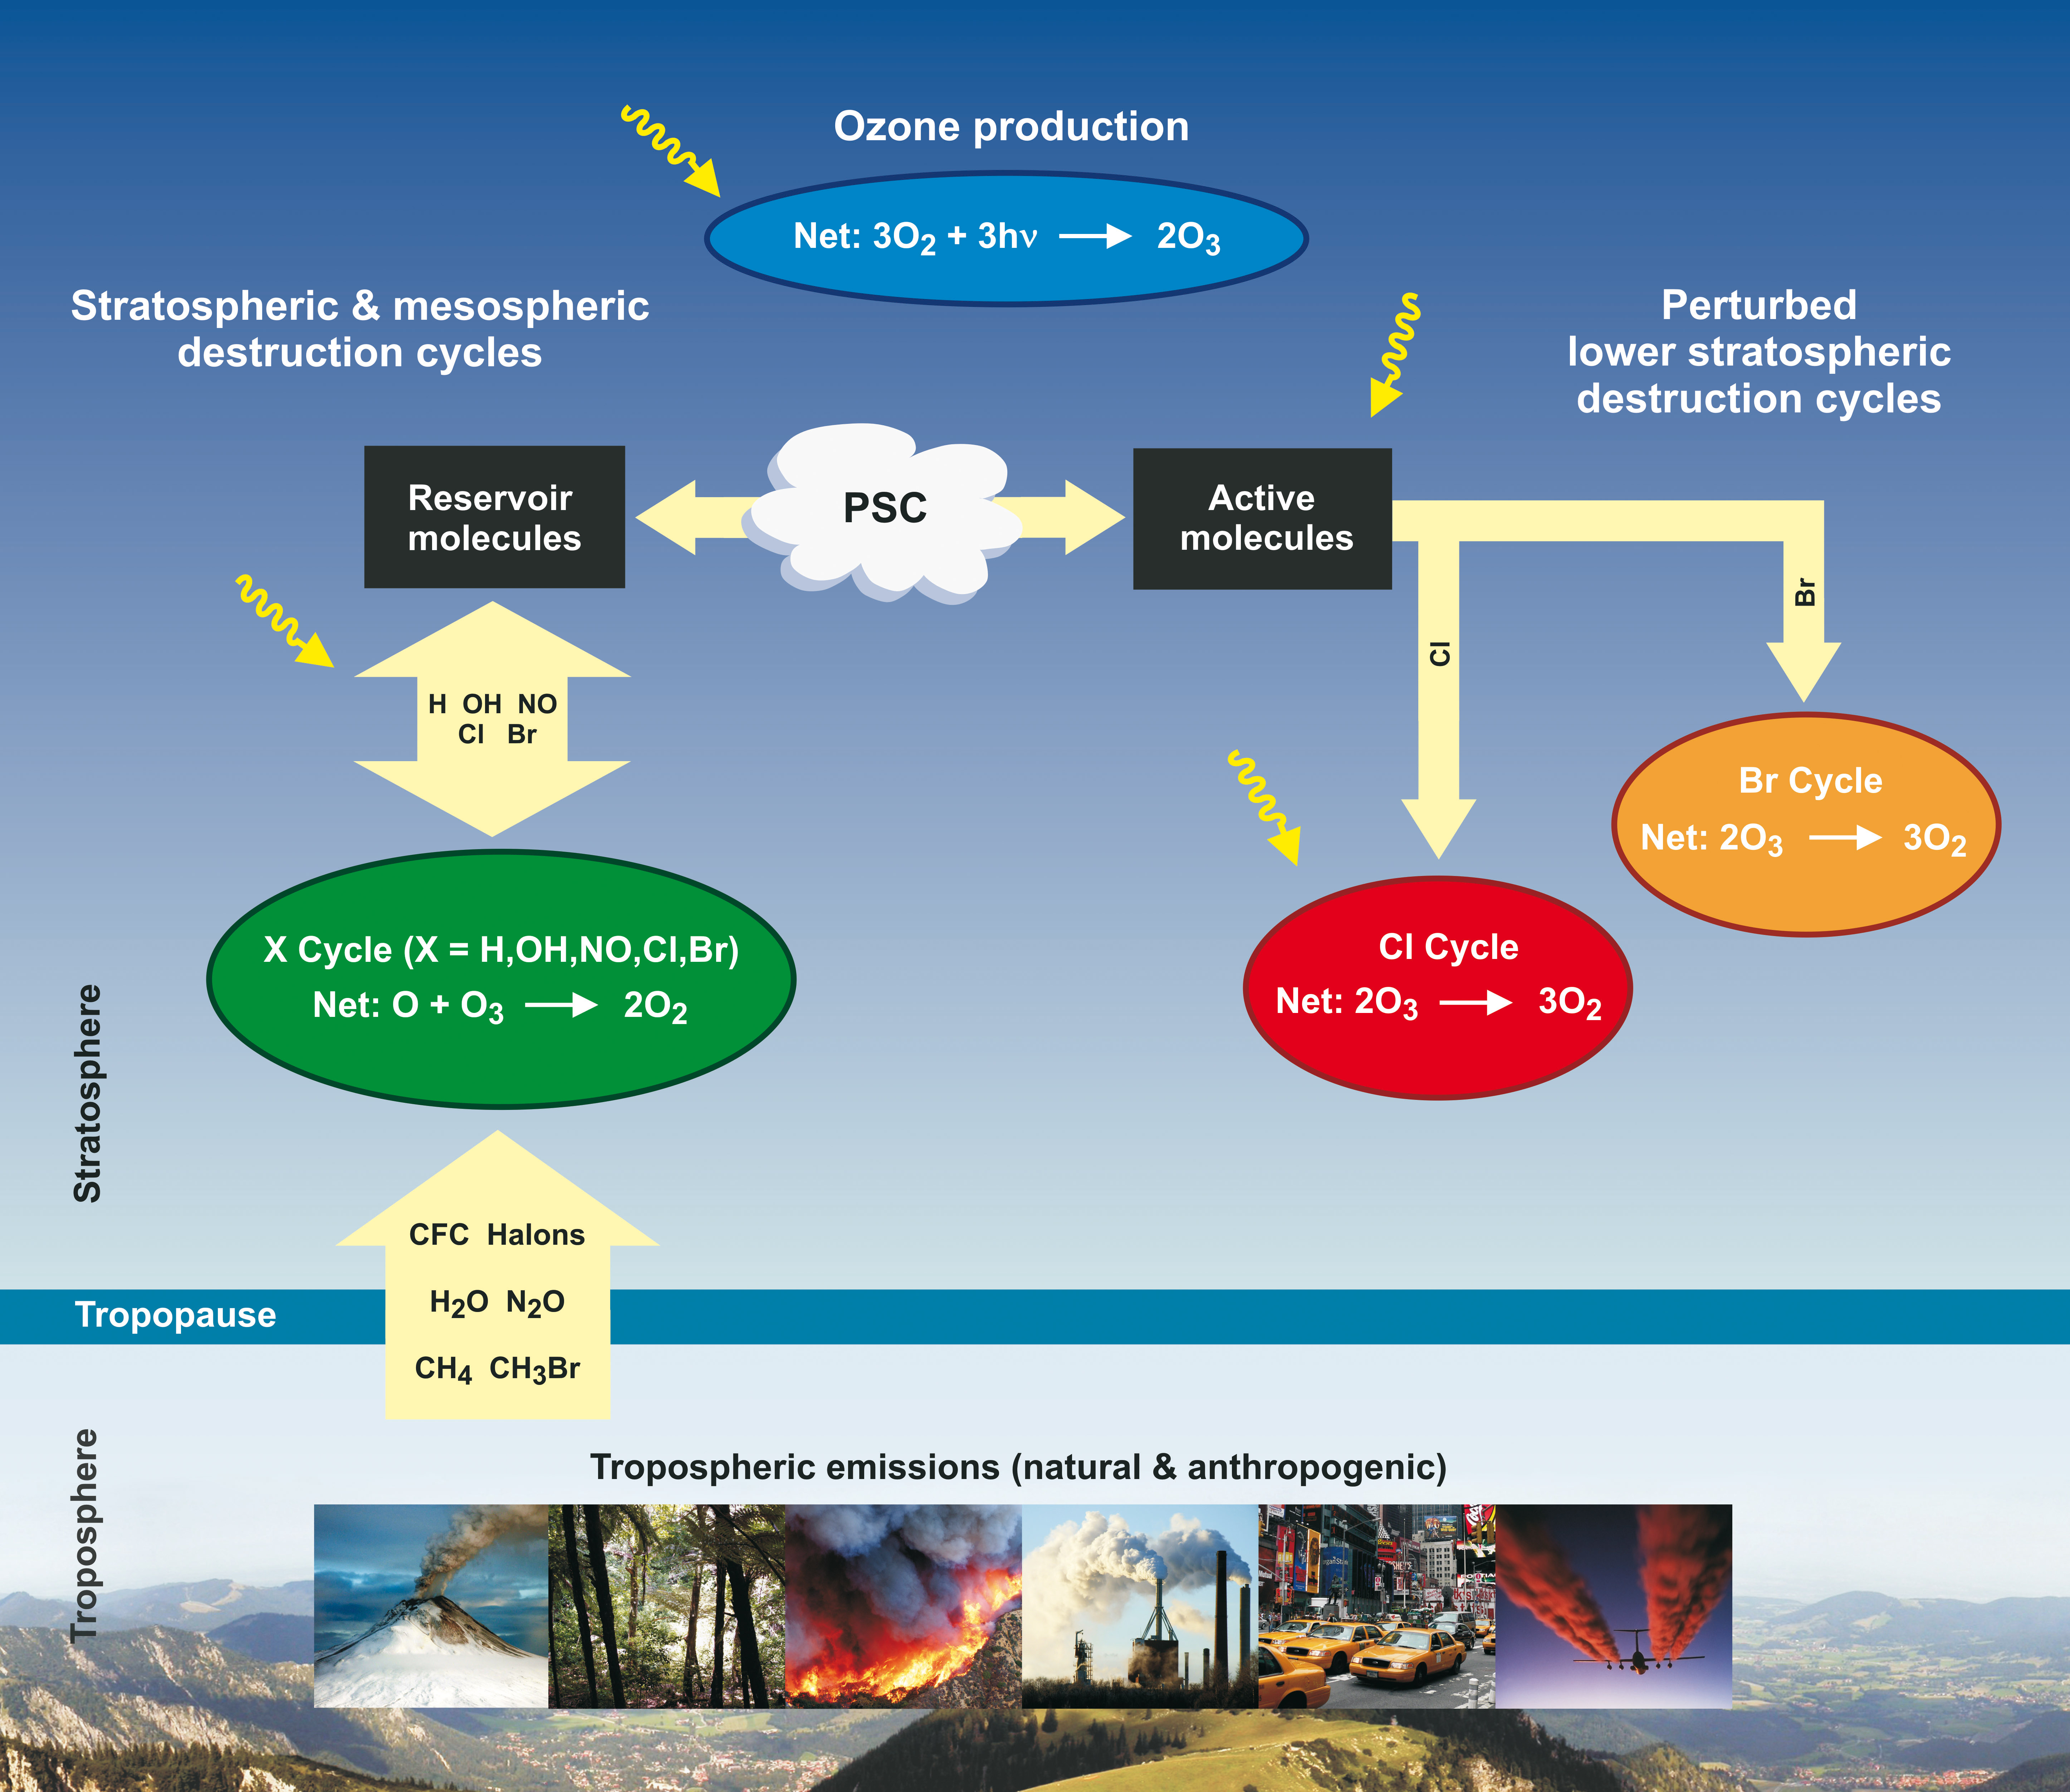
| Fig. 1-6 | Schematic sketch of the stratospheric ozone chemistry
showing production and major destruction cycles. (Courtesy: IUP-IFE, University of Bremen) |
|
Page generated 31 August 2011