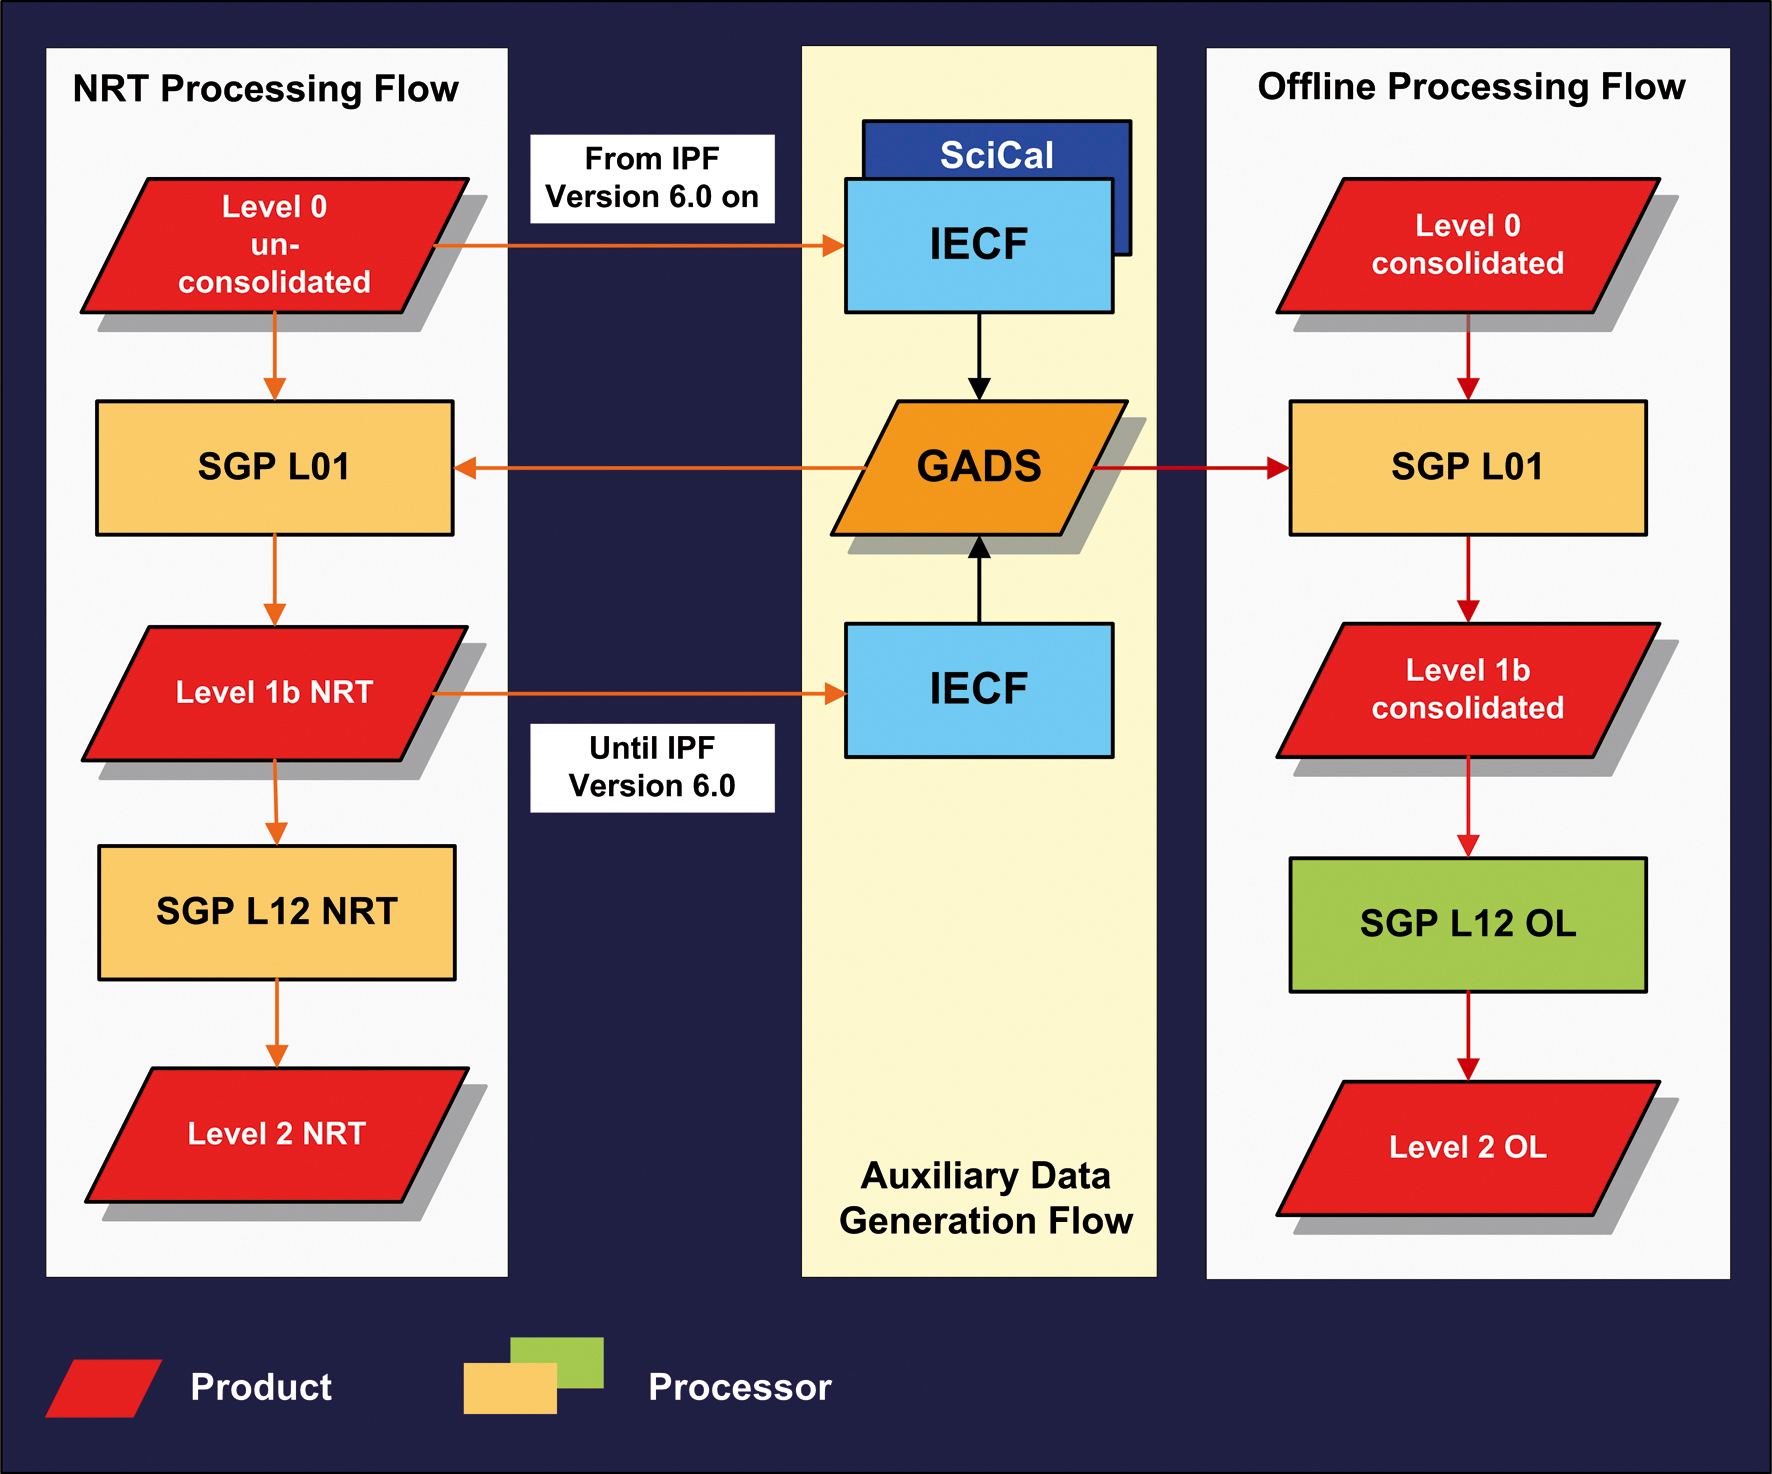
| Fig. 8-1 |
General processing flow in NRT (left) and OL (right). Both chains
receive the calibration information from the same auxiliary flow. (graphics: DLRIMF) |
|
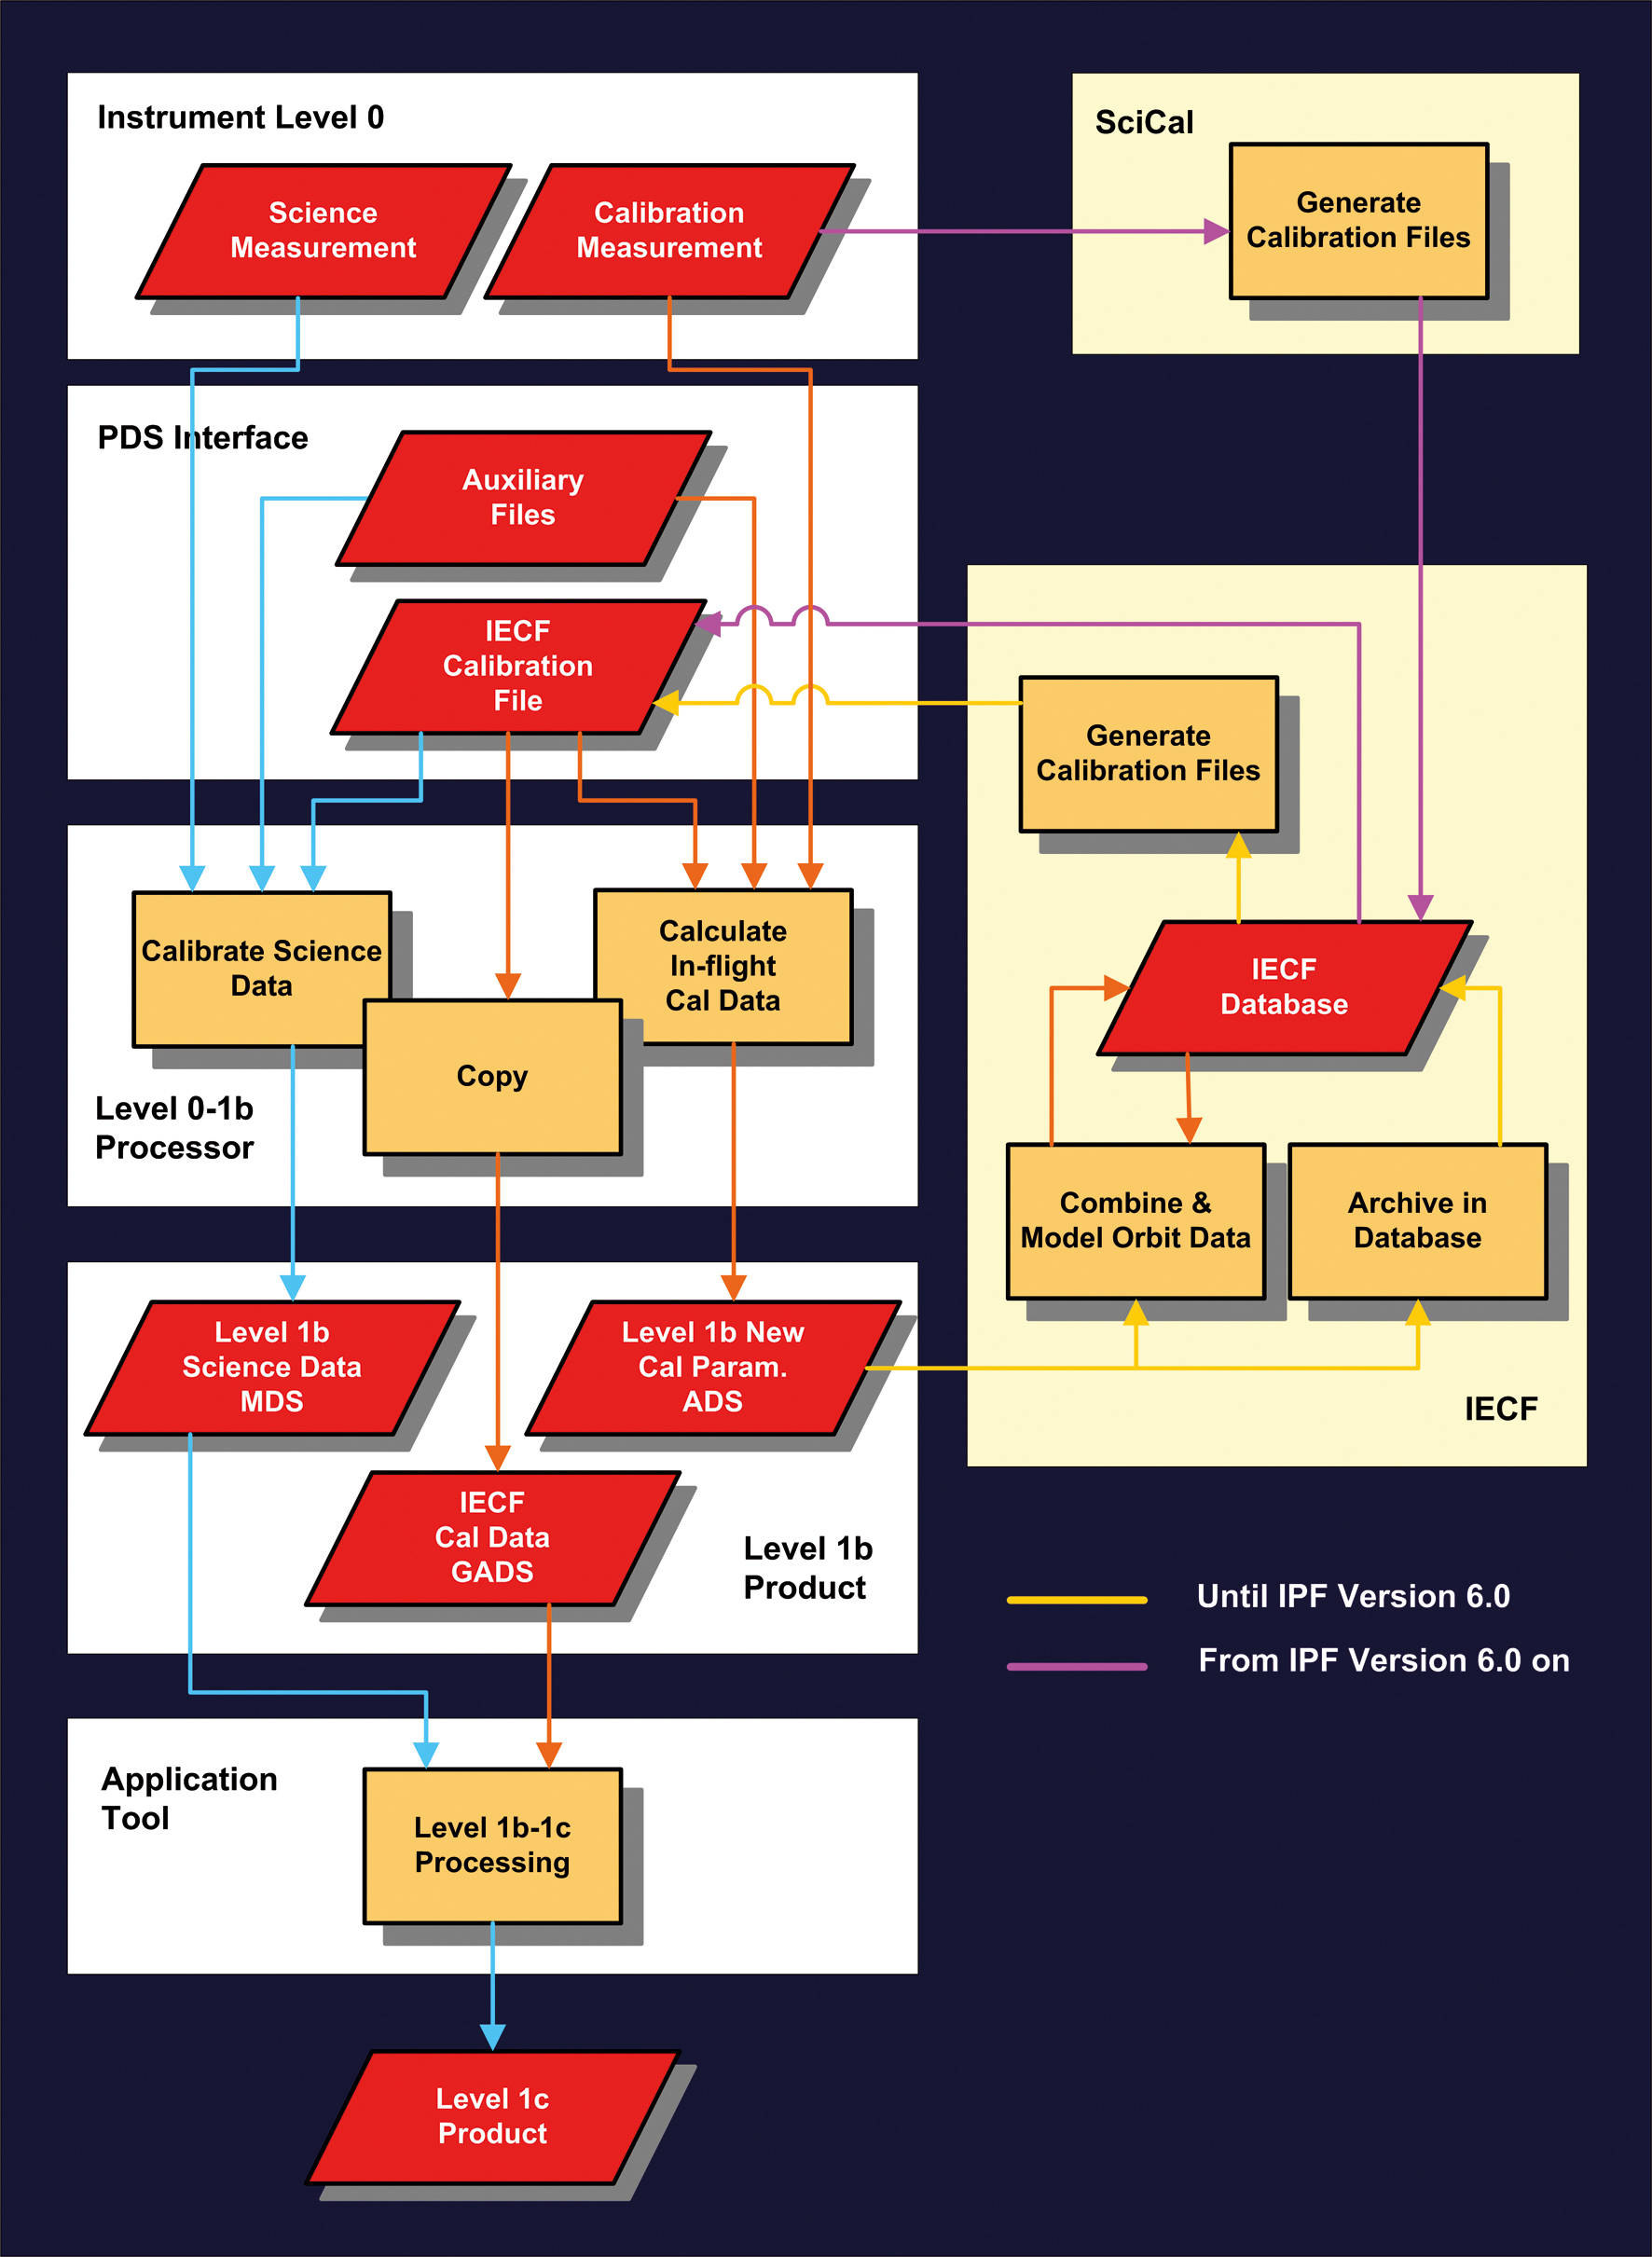
| Fig. 8-2 | Sketch
of operational data processing from level 0 to level 1b and level 1c. (graphics: DLR-IMF) |
|
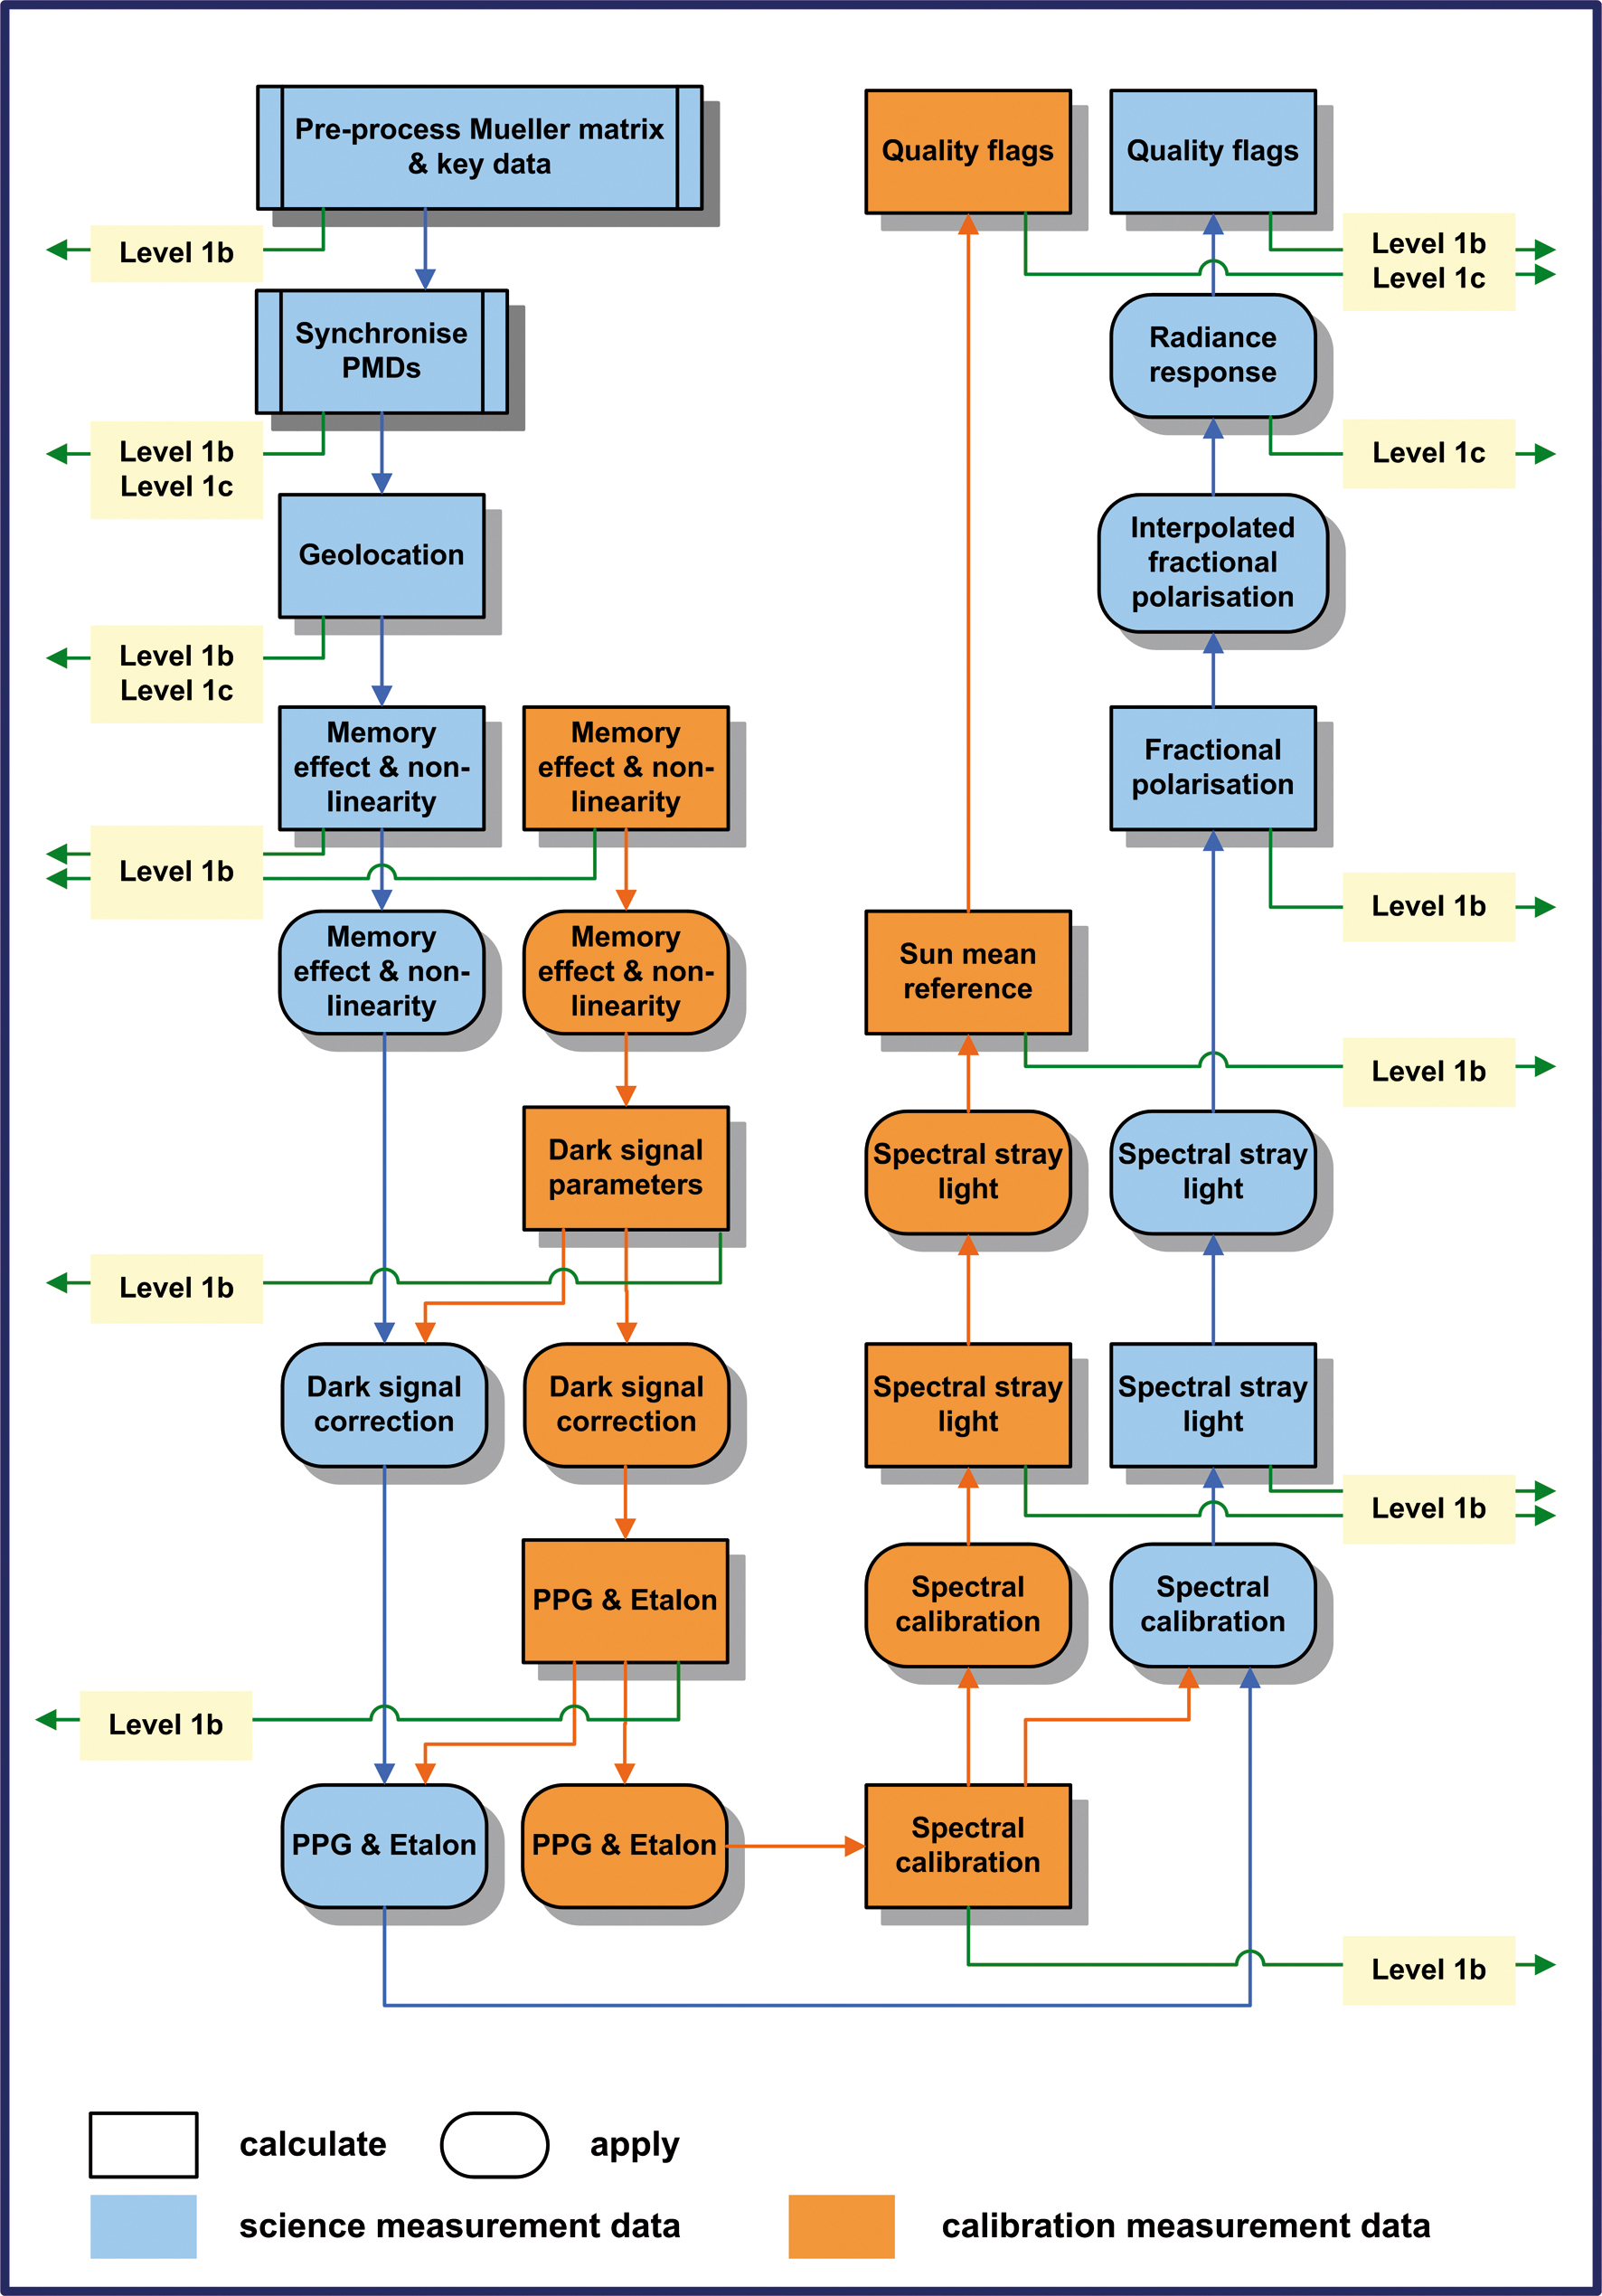
| Fig. 8-3 | Science
and calibration measurements data flow. Algorithms applied to scientific measurements are in blue
boxes, while calibration measurement algorithms are highlighted in orange boxes. Also indicated is the output into
the level 1b or level 1c intermediate product. (graphics: DLR-IMF) |
|
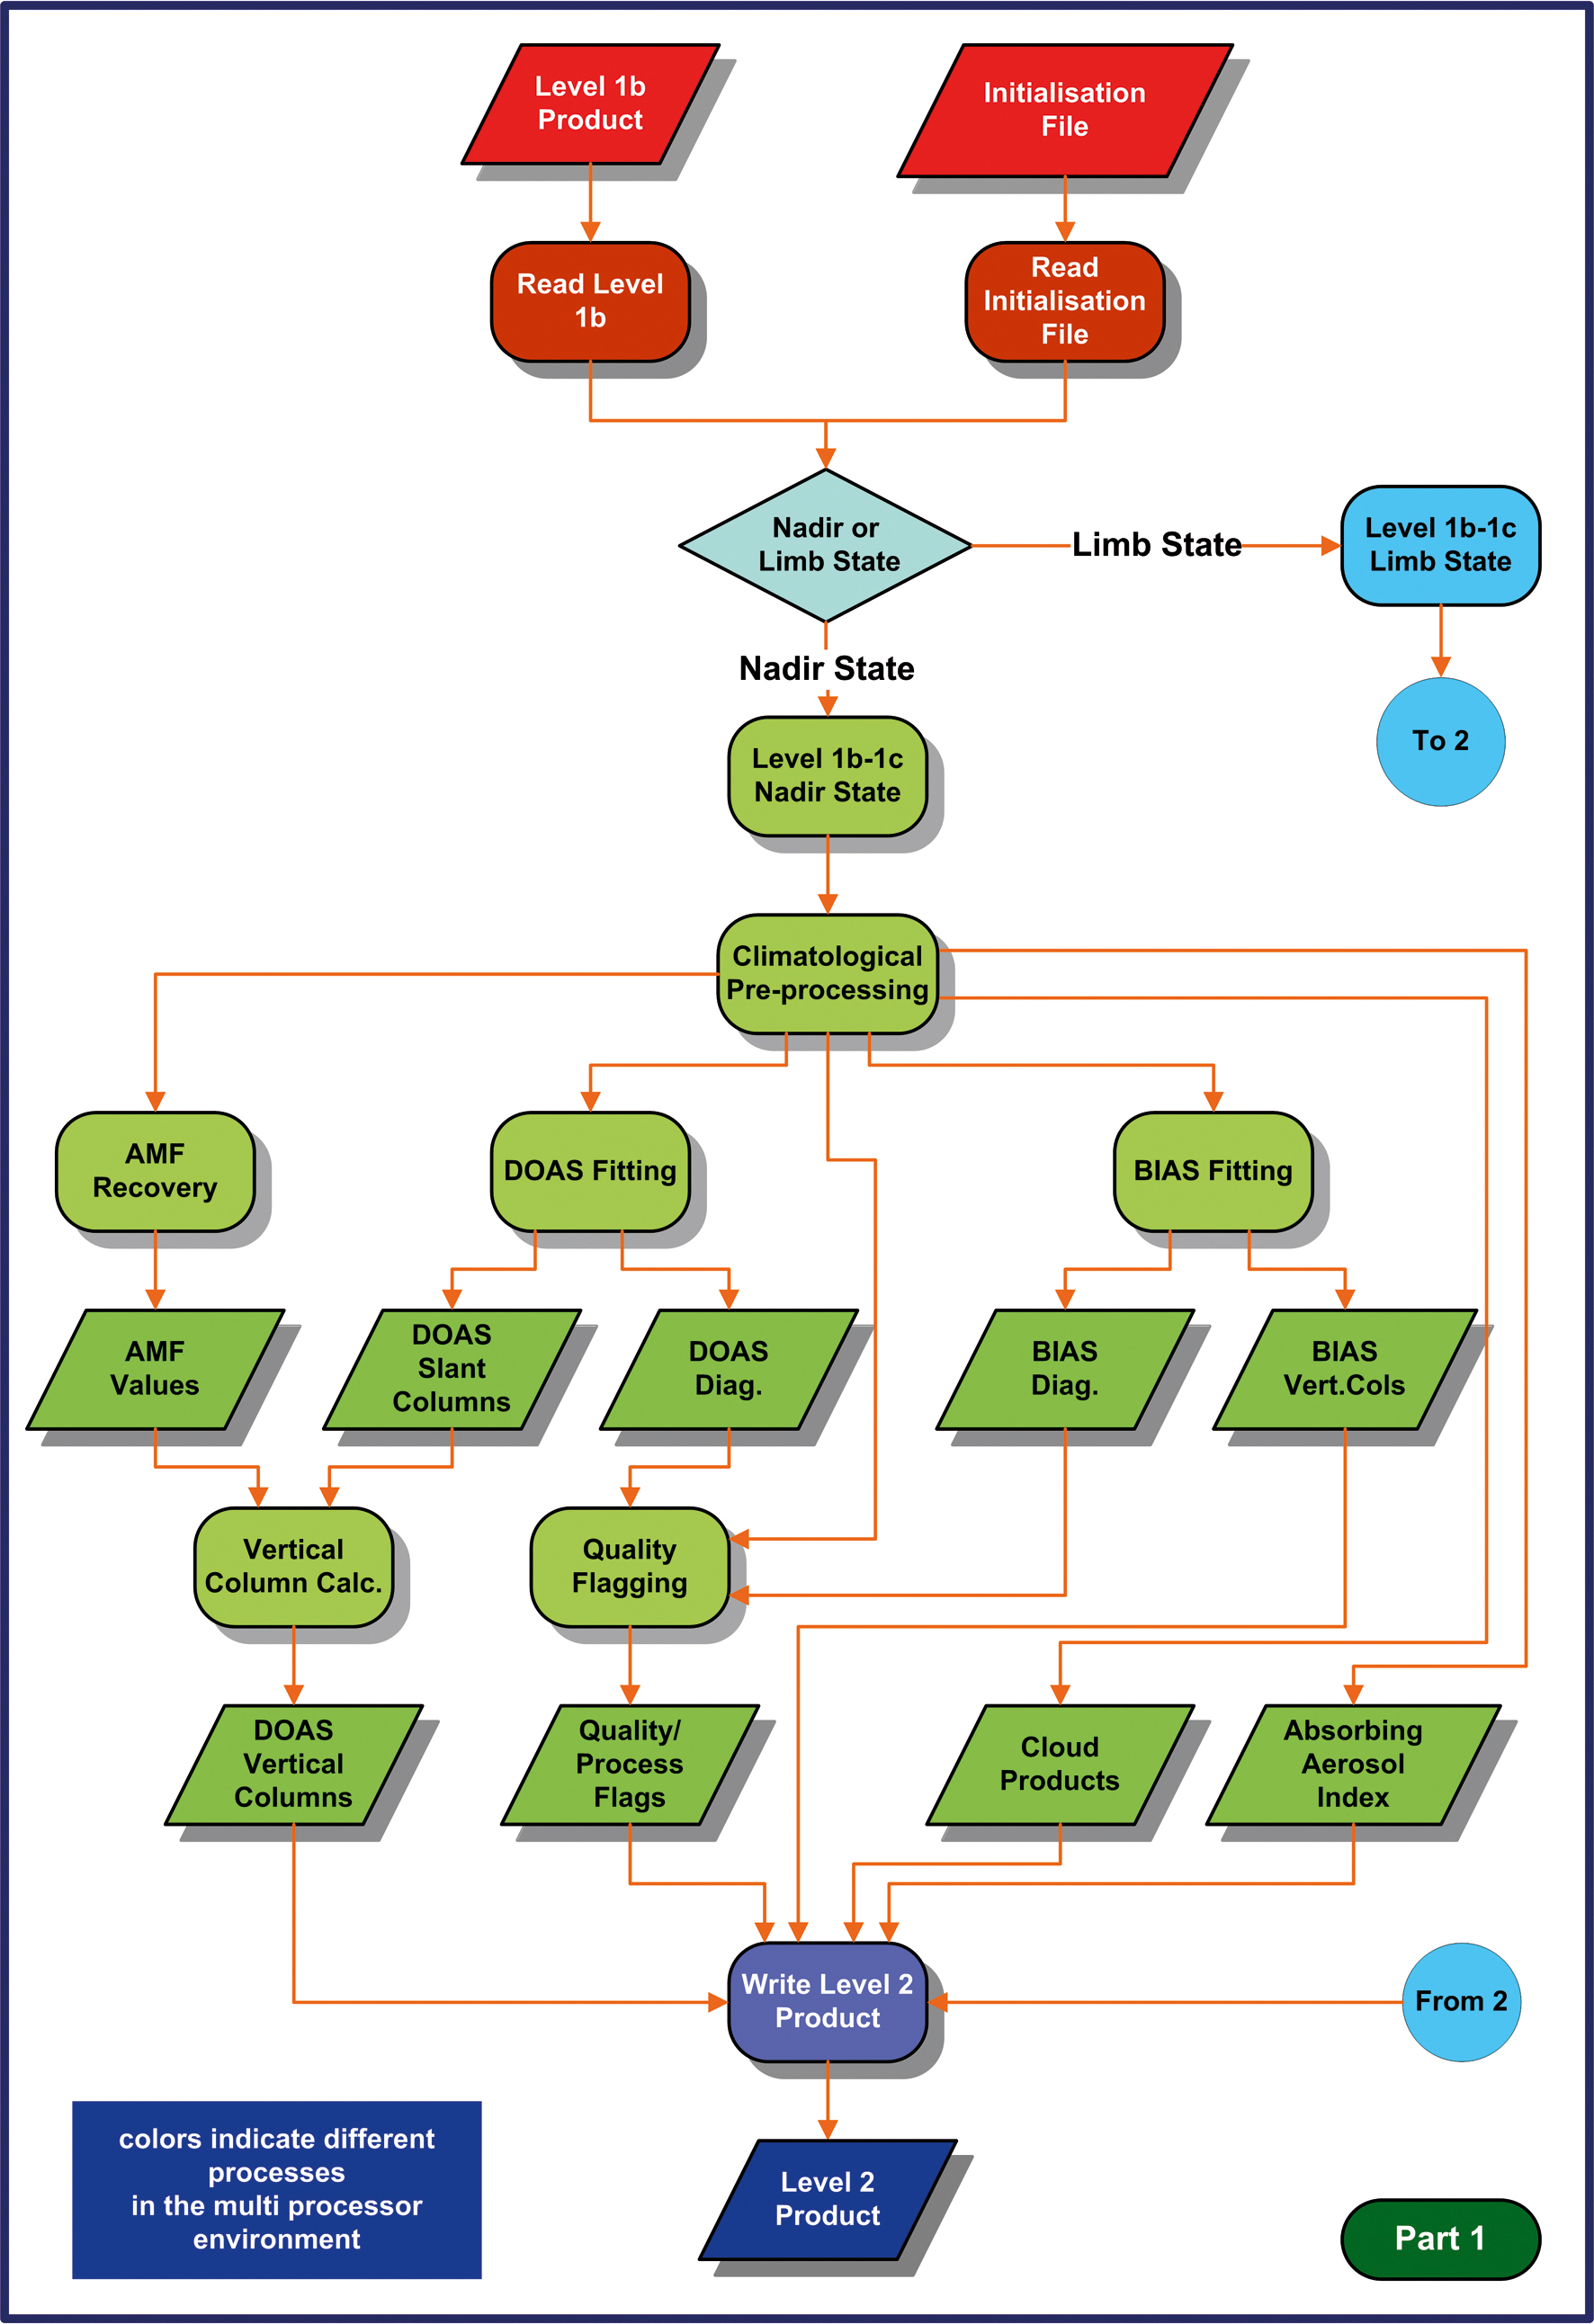
| Fig. 8-4 | Level
1b-2 data processing flow diagram. Limb algorithms are continued in fig.8-5. (graphics: DLR-IMF) |
|
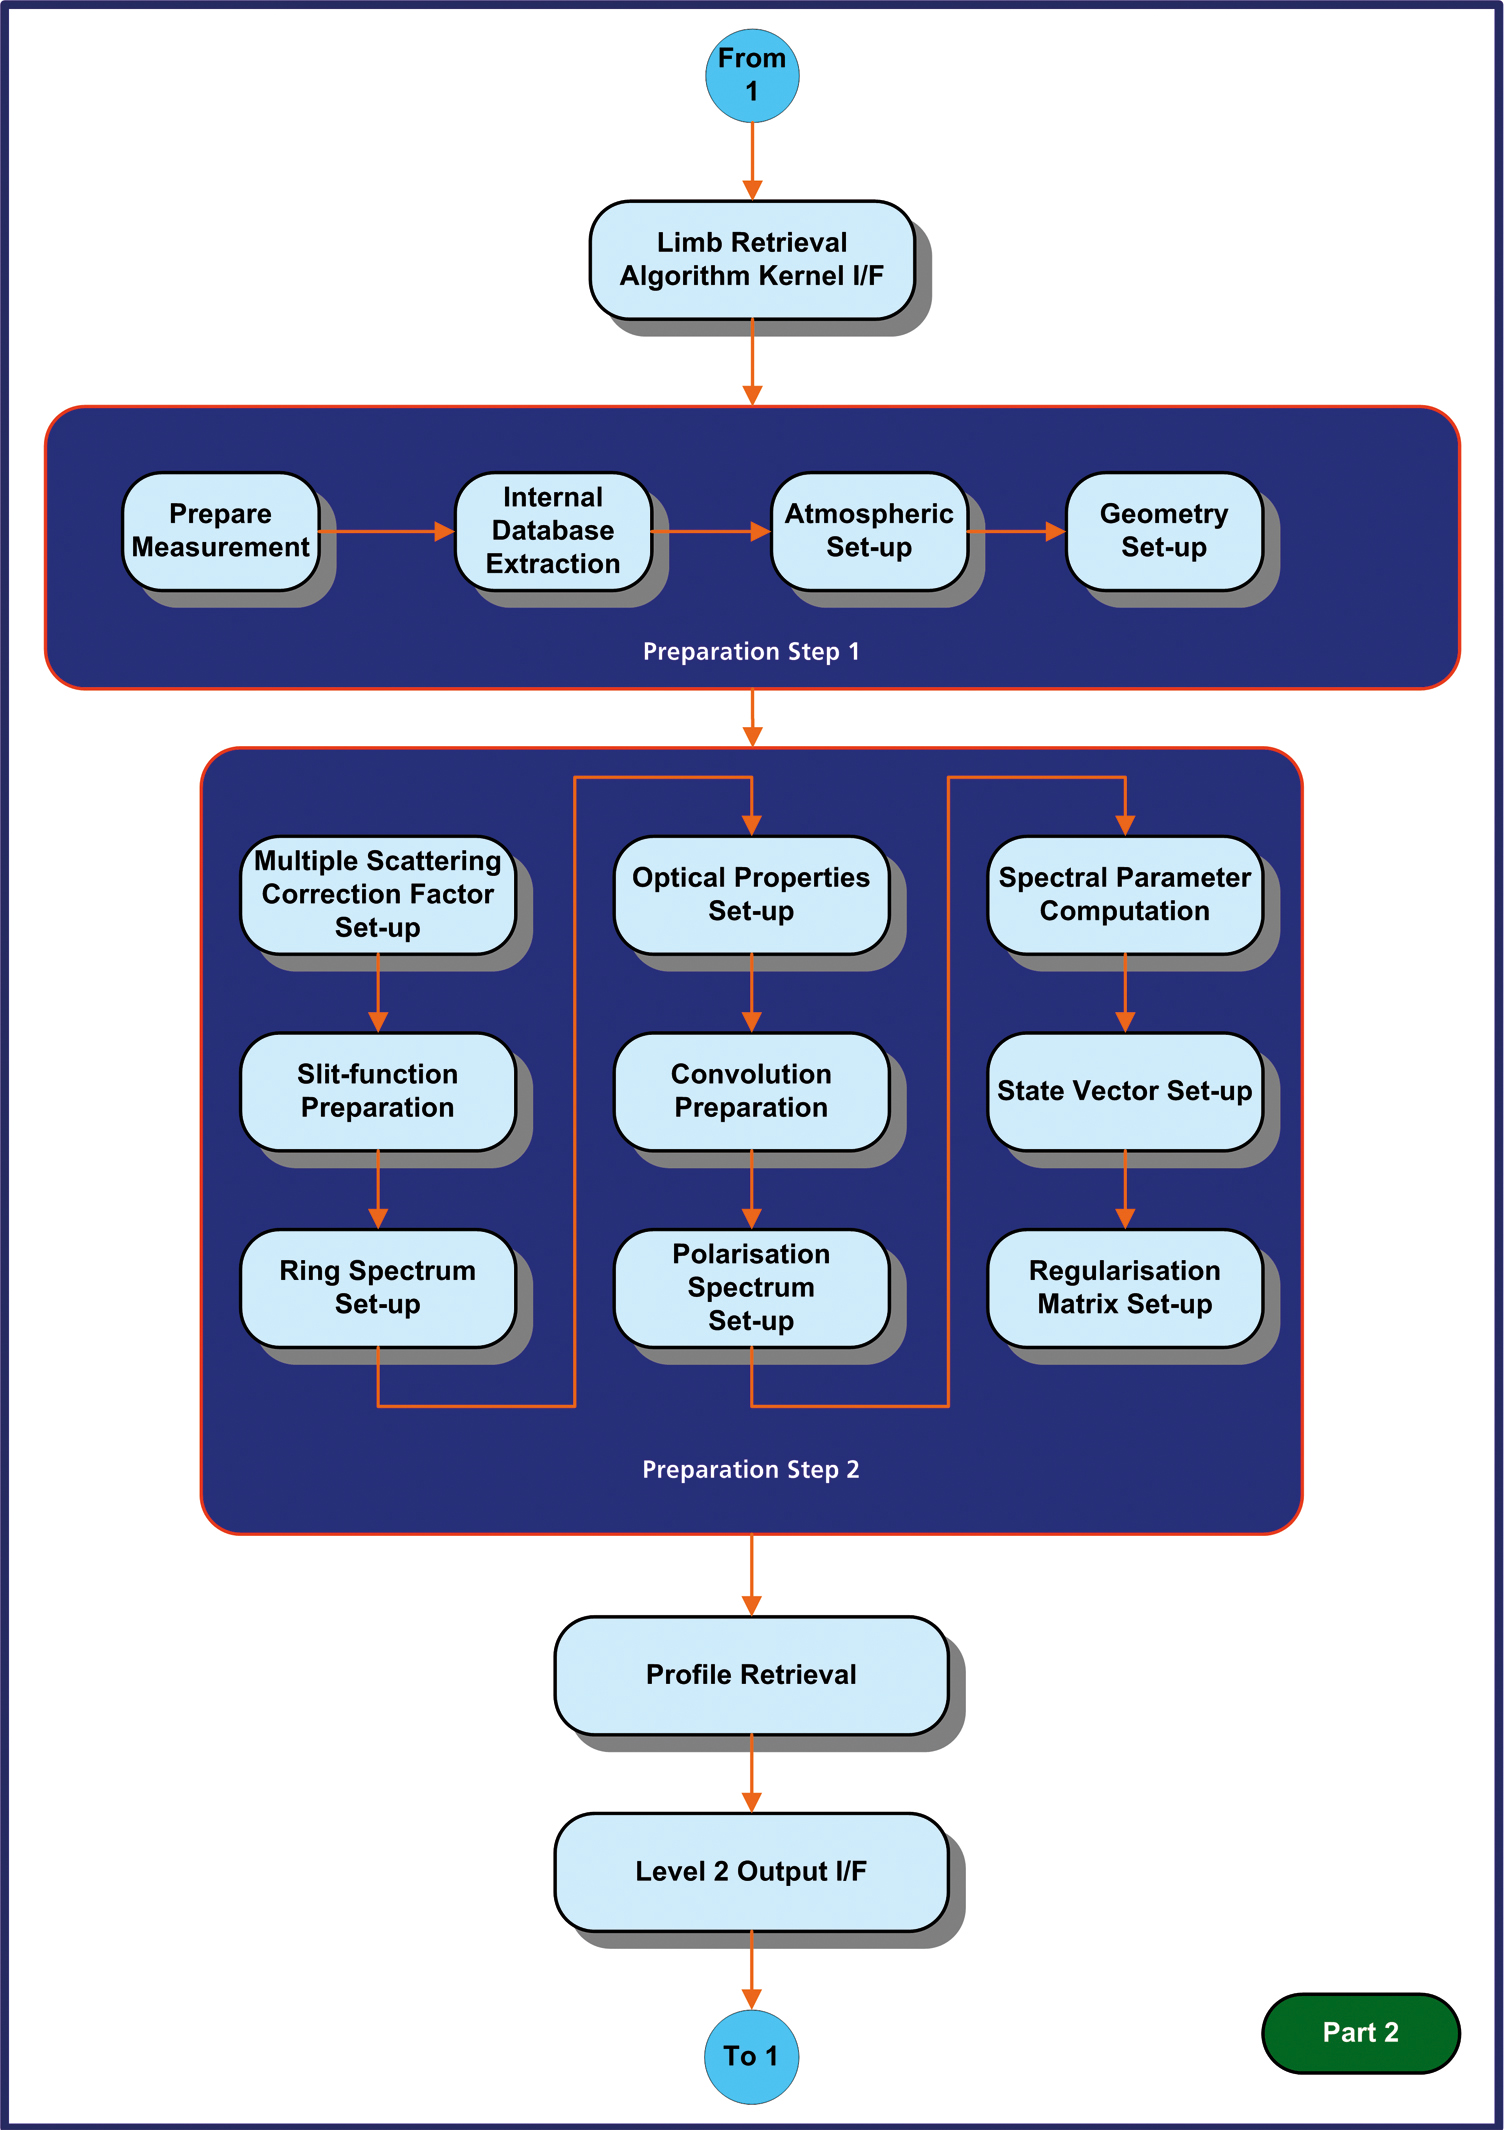
| Fig. 8-5 | Level
1b-2 data processing flow diagram for limb retrieval. At the end of the limb processing, the data
flow returns to fig. 8-4 for product output. (graphics: DLR-IMF) |
 |
Page generated 26 March 2007