| Fig. 5-1 | Calibration
concept for SCIAMACHY. The final calibrated
Earth radiance spectra are obtained by applying several
calibration steps to the measured Earthshine signals.
They include in-flight calibration measurements (red), onground
measurements performed under thermal vacuum
conditions (green) and component measurements from onground
ambient tests (blue). The optical performance monitoring
(red) provides additional corrections. (graphics: SRON) |

|
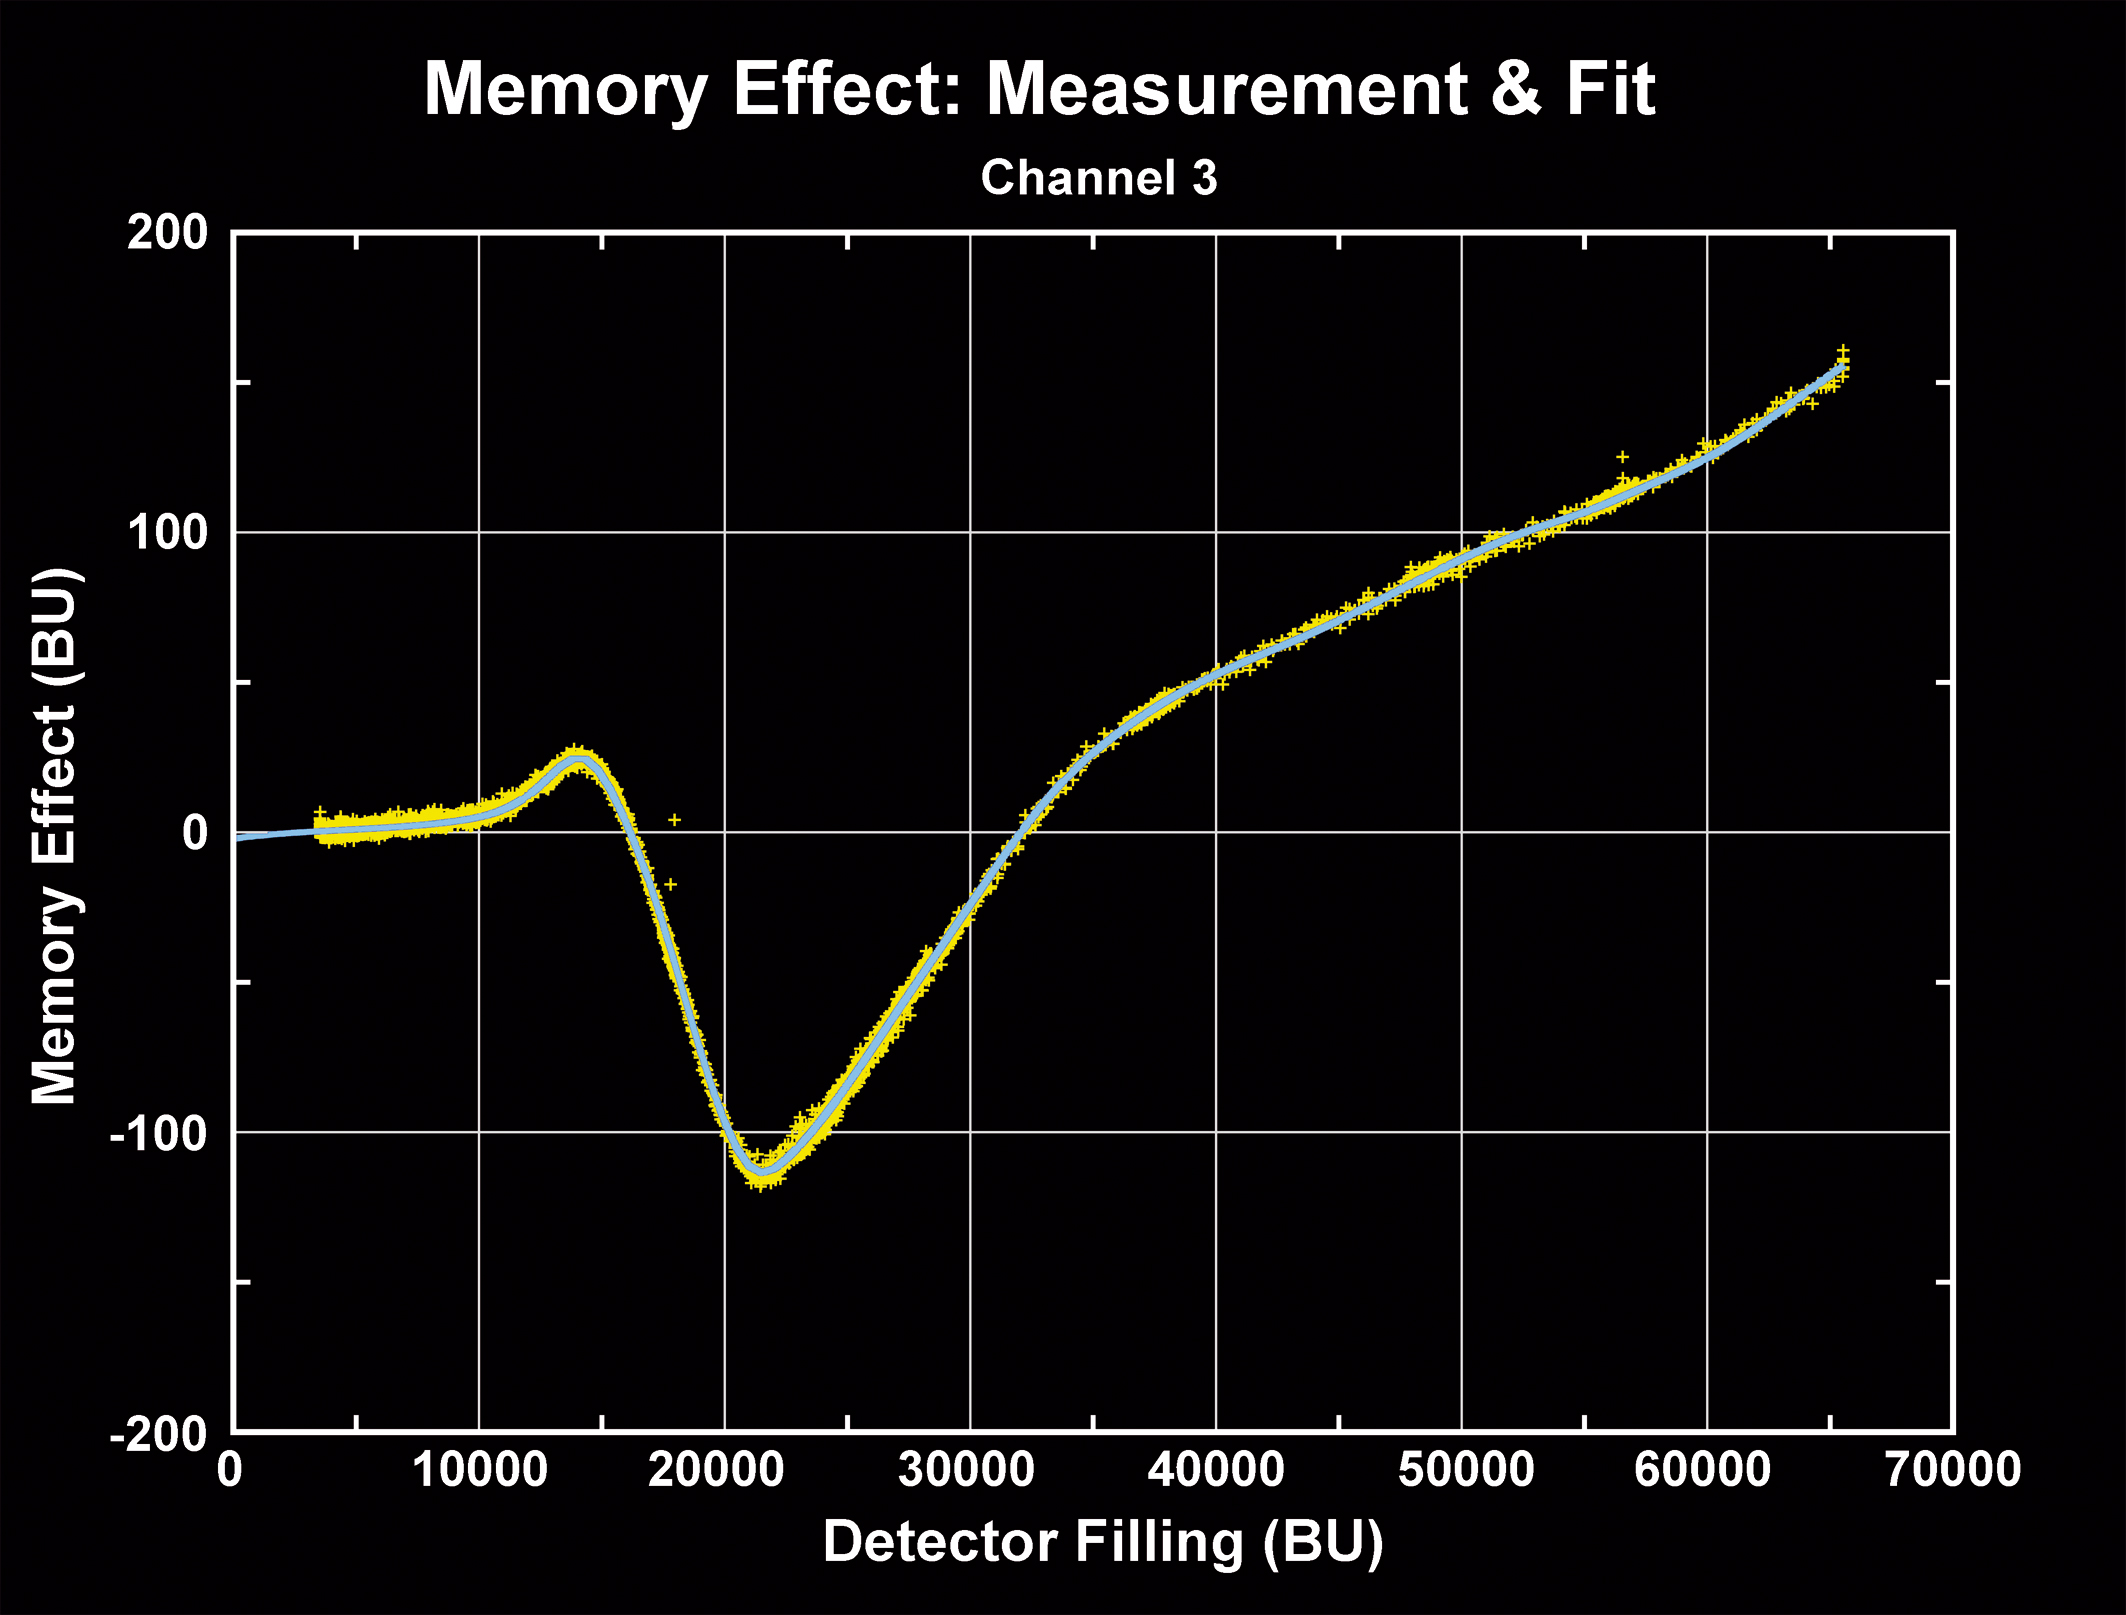
| Fig. 5-2 | Memory
effect for channel 3. Yellow crosses mark the in-flight
measurement of the Memory effect. The blue solid line is a spline fit
through the measurements that is used for the correction. (graphics:
SRON) |
|
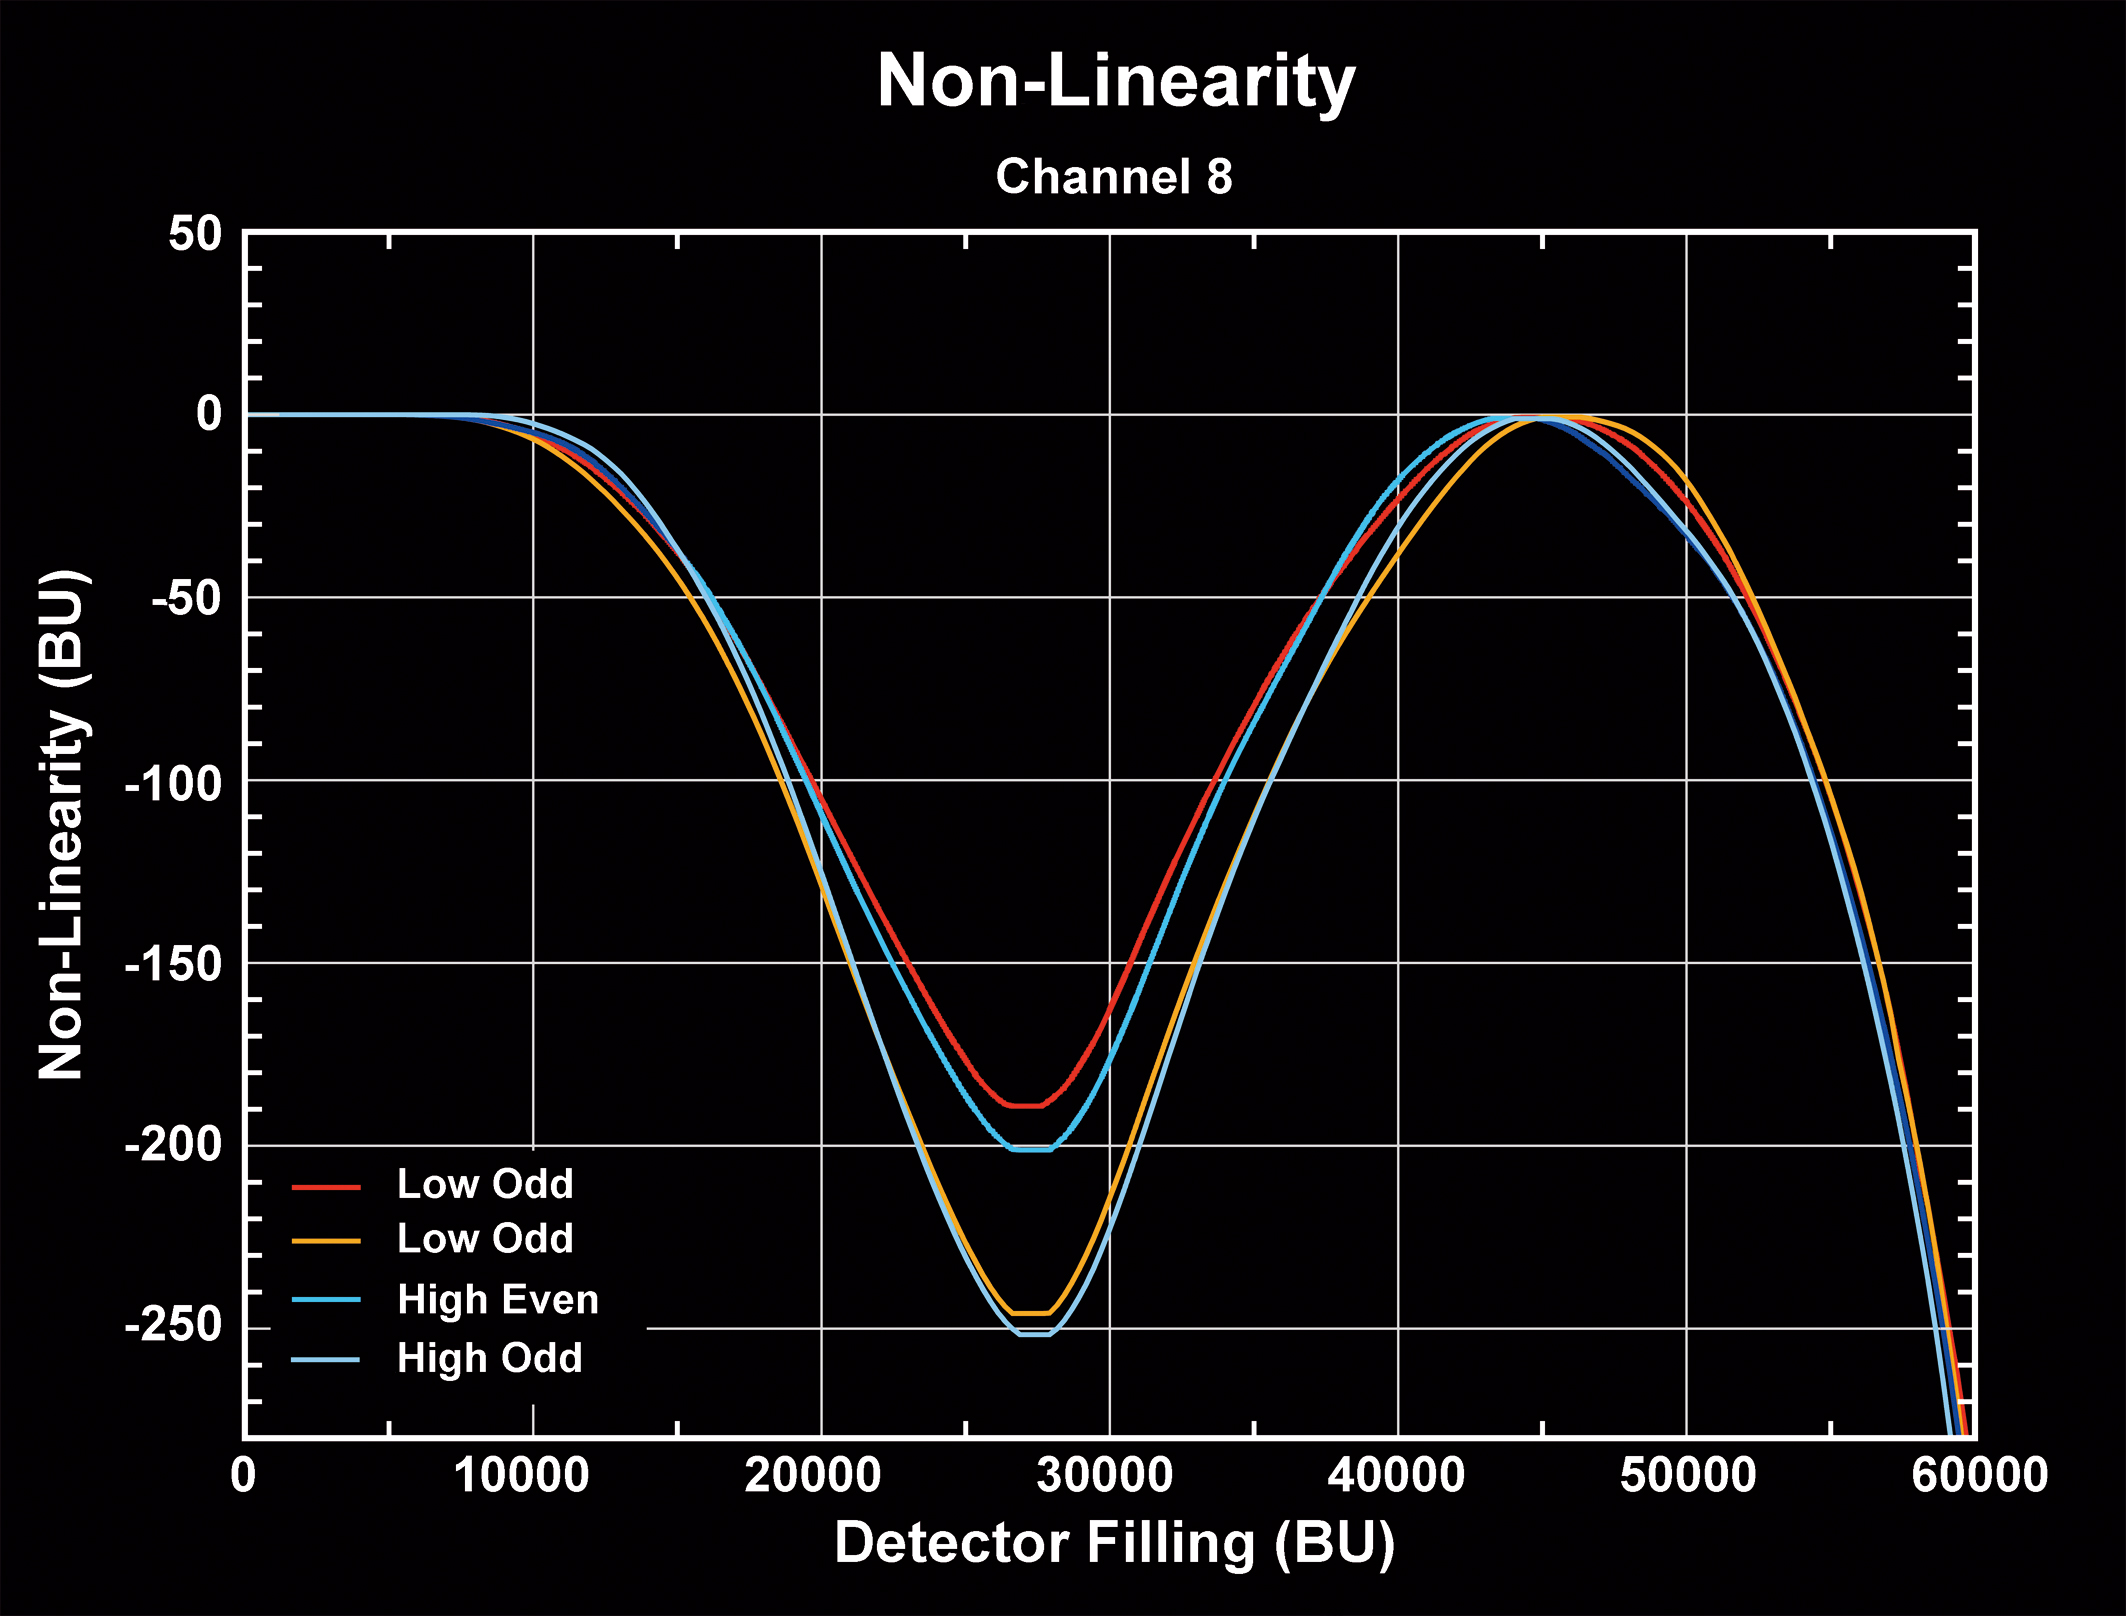
| Fig. 5-3 | Non-Linearity
in channel 8 for different pixel regions (indicated
by colours). ‘Low’ pixels are those with pixel numbers below
512. The
pixel numbering starts at 0. (graphics: SRON) |
|
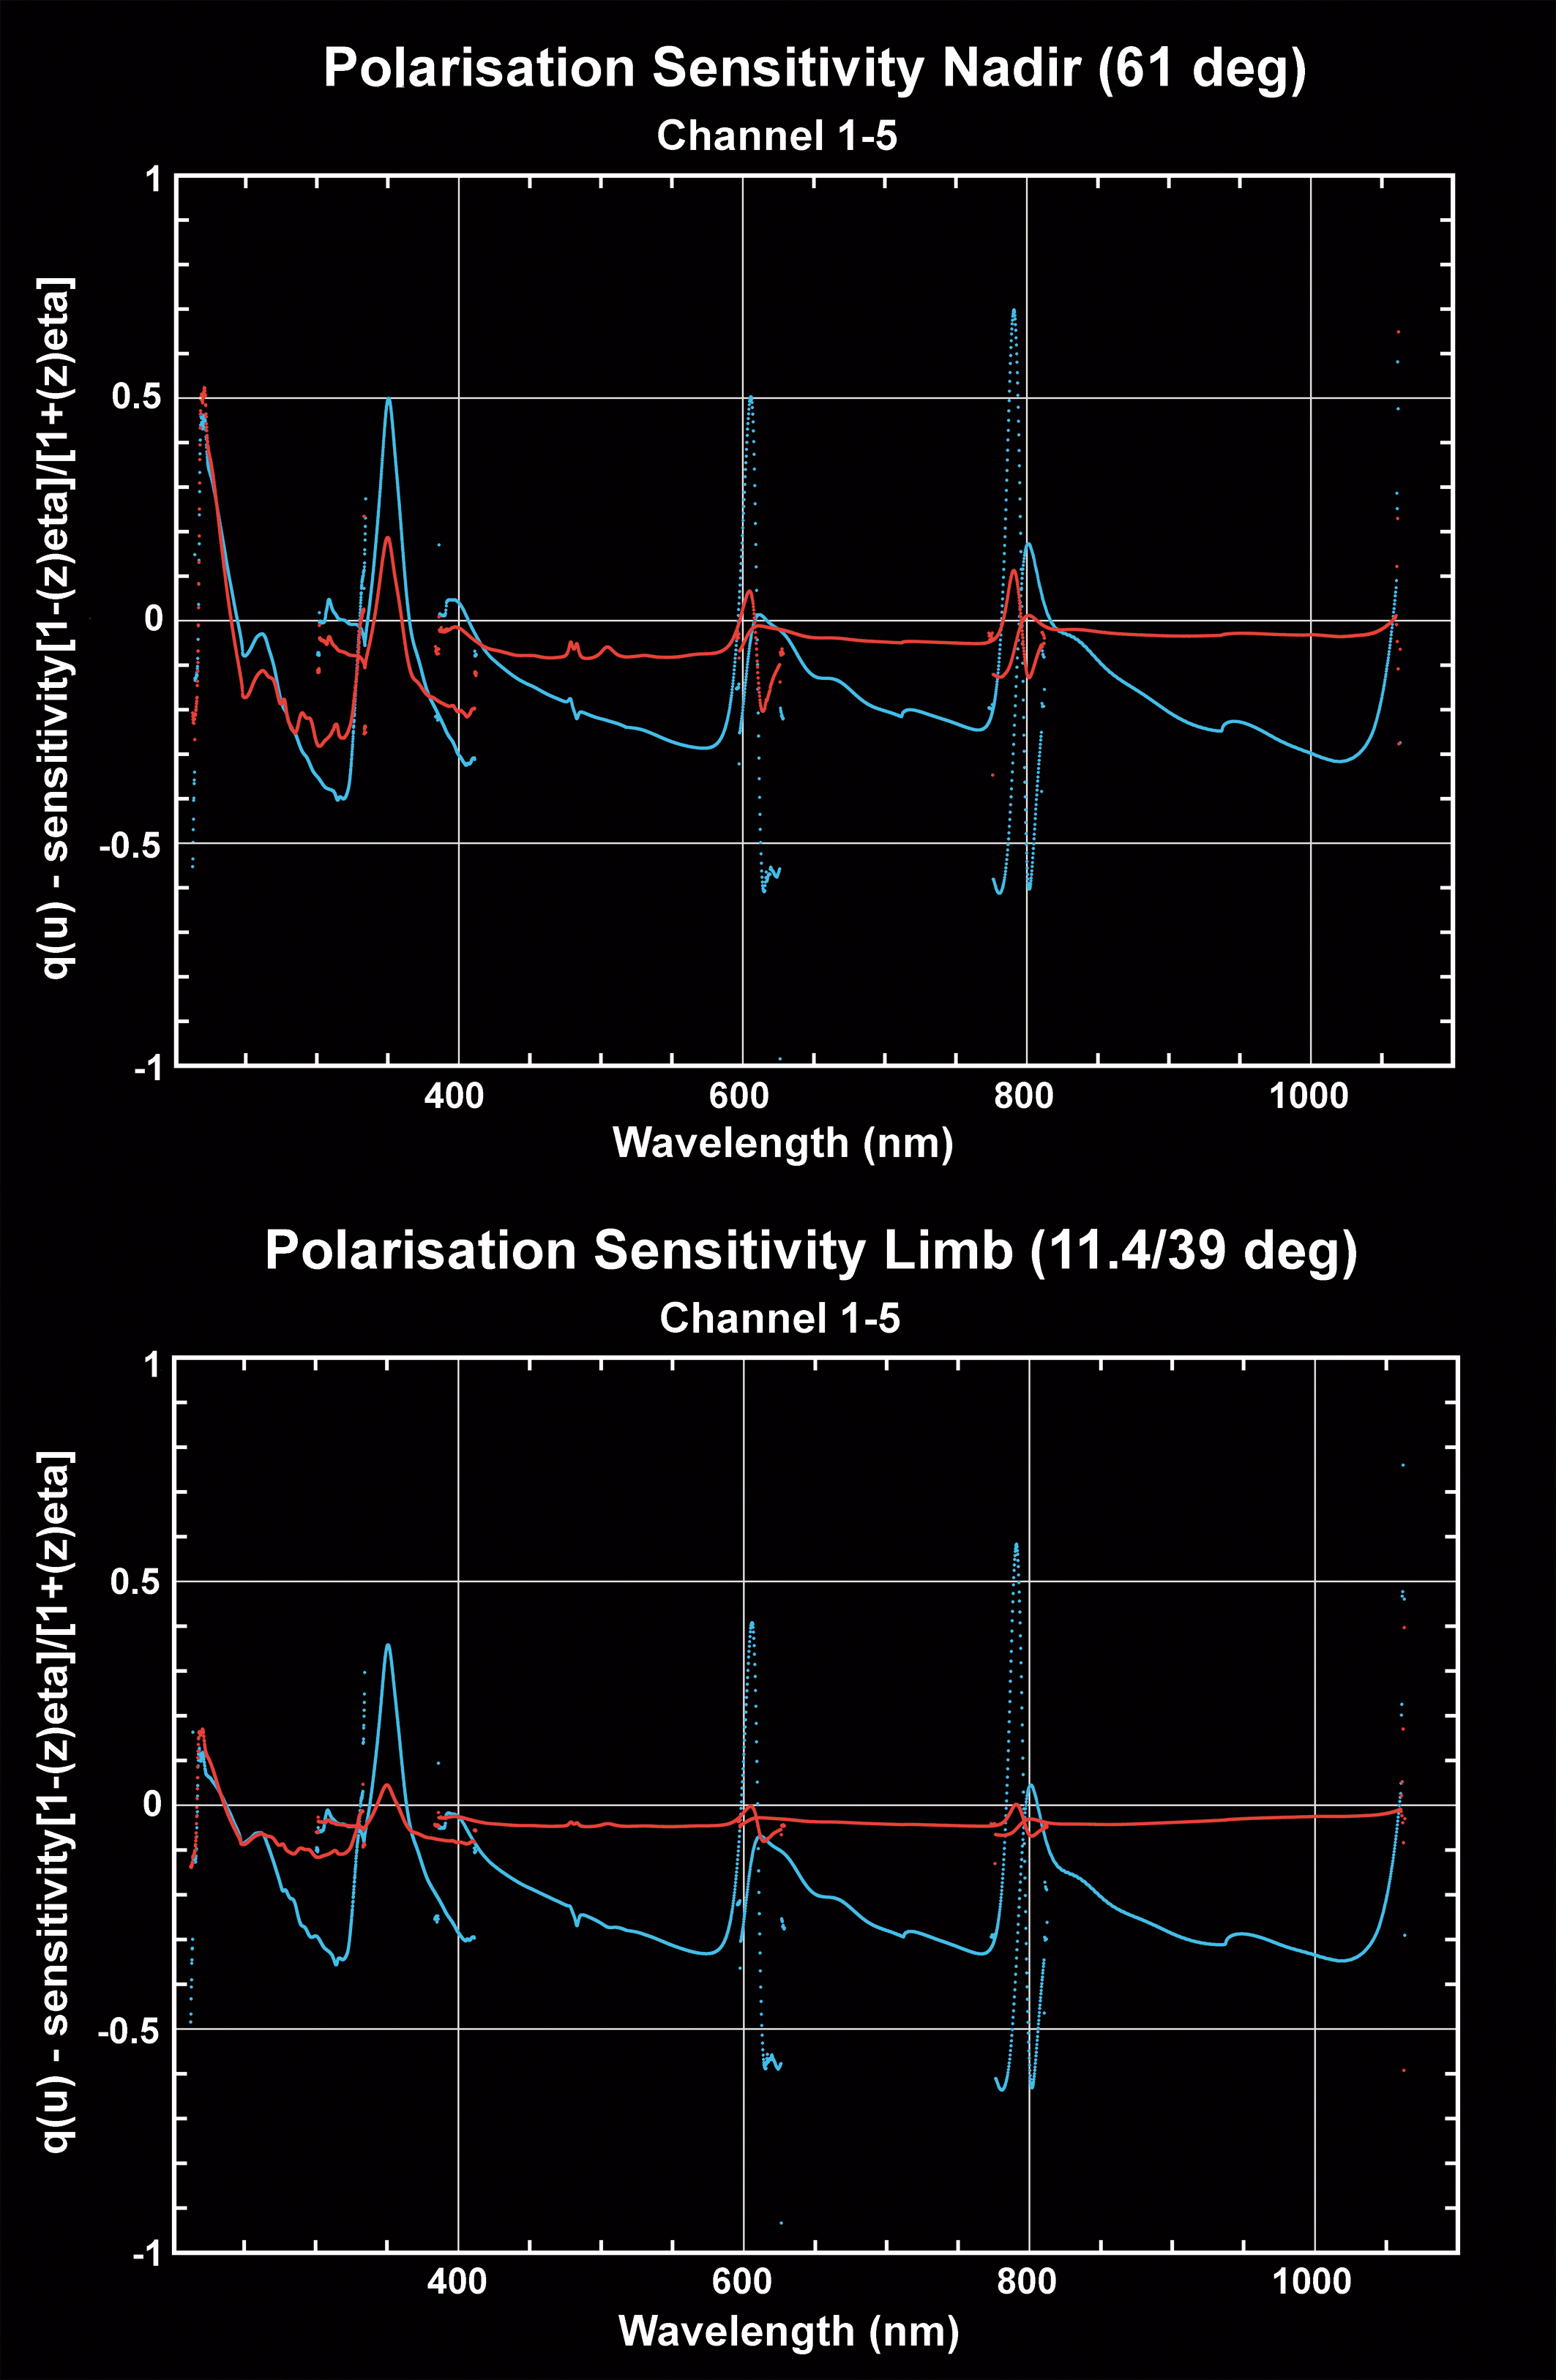
| Fig. 5-4 | q
(blue) and u (red) sensitivity from equ. 5-6 for nadir (elevation
angle of 61° top) and for limb (elevation angle of 11.4° and azimuth angle
of 39°, bottom) for channels 1-5. Note that these sensitivities are multiplied
with the polarisation fractions to get cpol and the correction will thus be
smaller than displayed for lower polarisation. (graphics: SRON) |
|
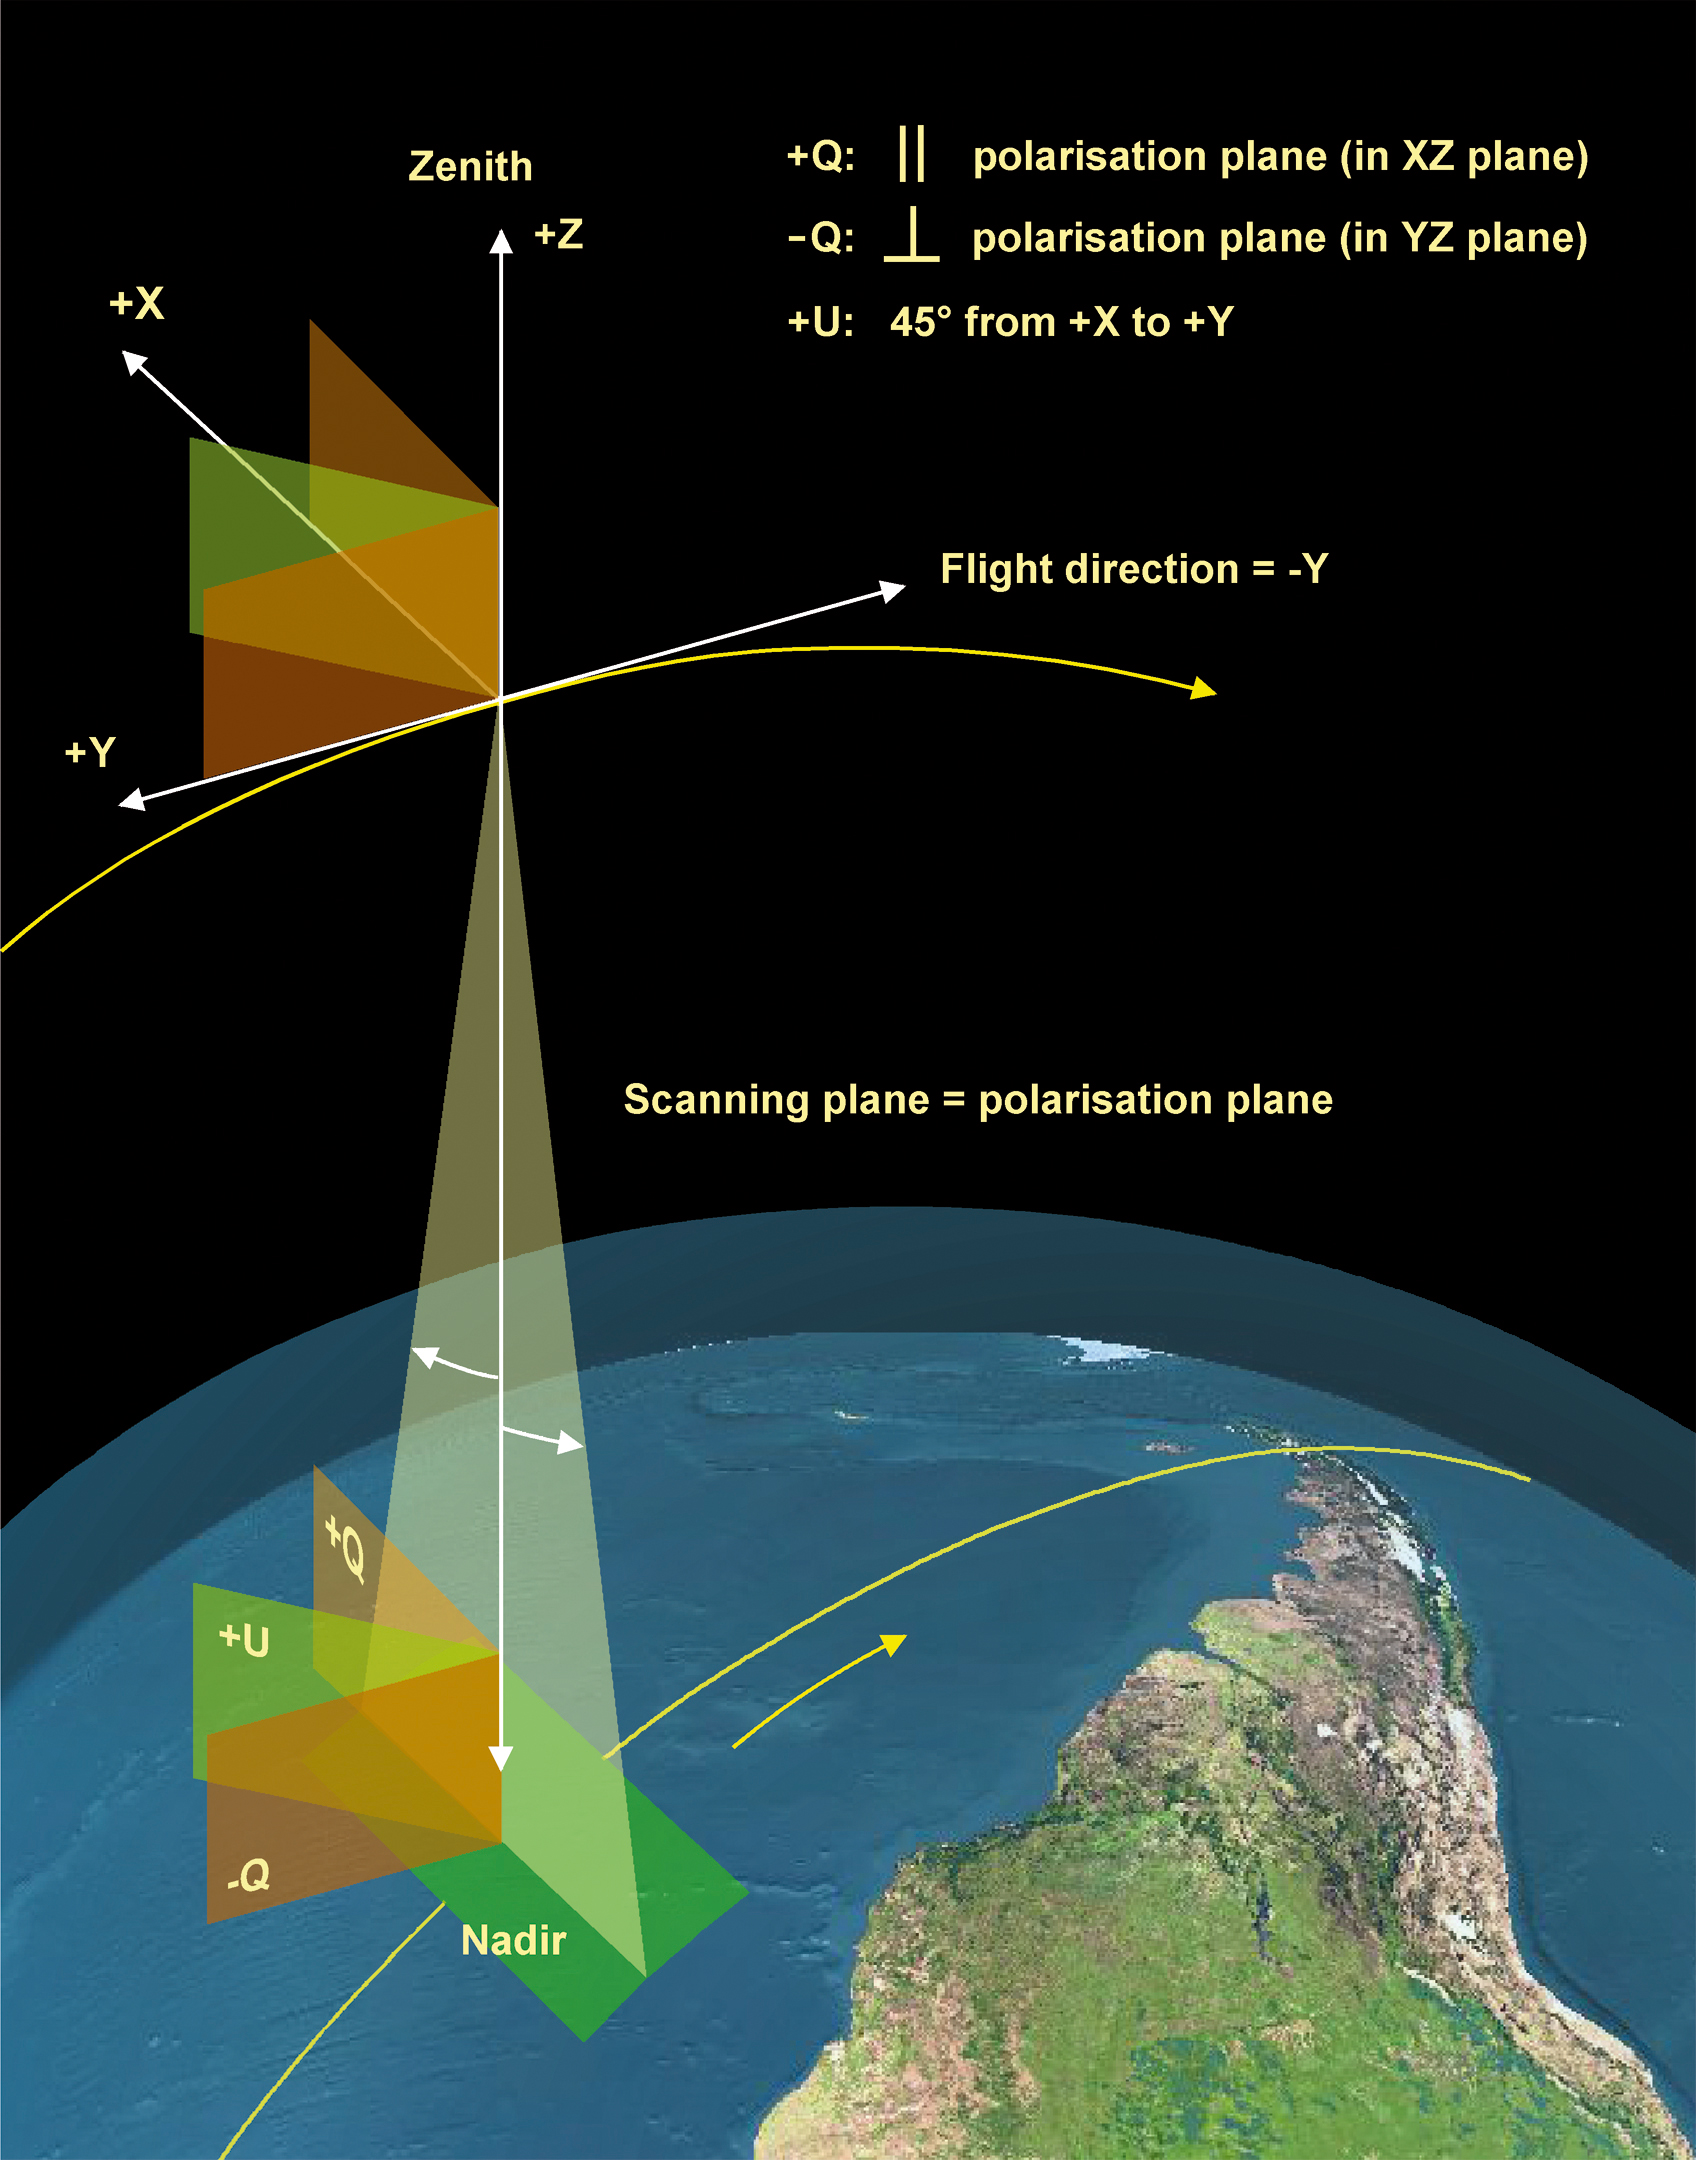
| Fig. 5-5 | Definition
of the coordinate frame used in the data processor for polarisation values q = Q/I, u = U/I.
(graphics: DLR-IMF) |
|
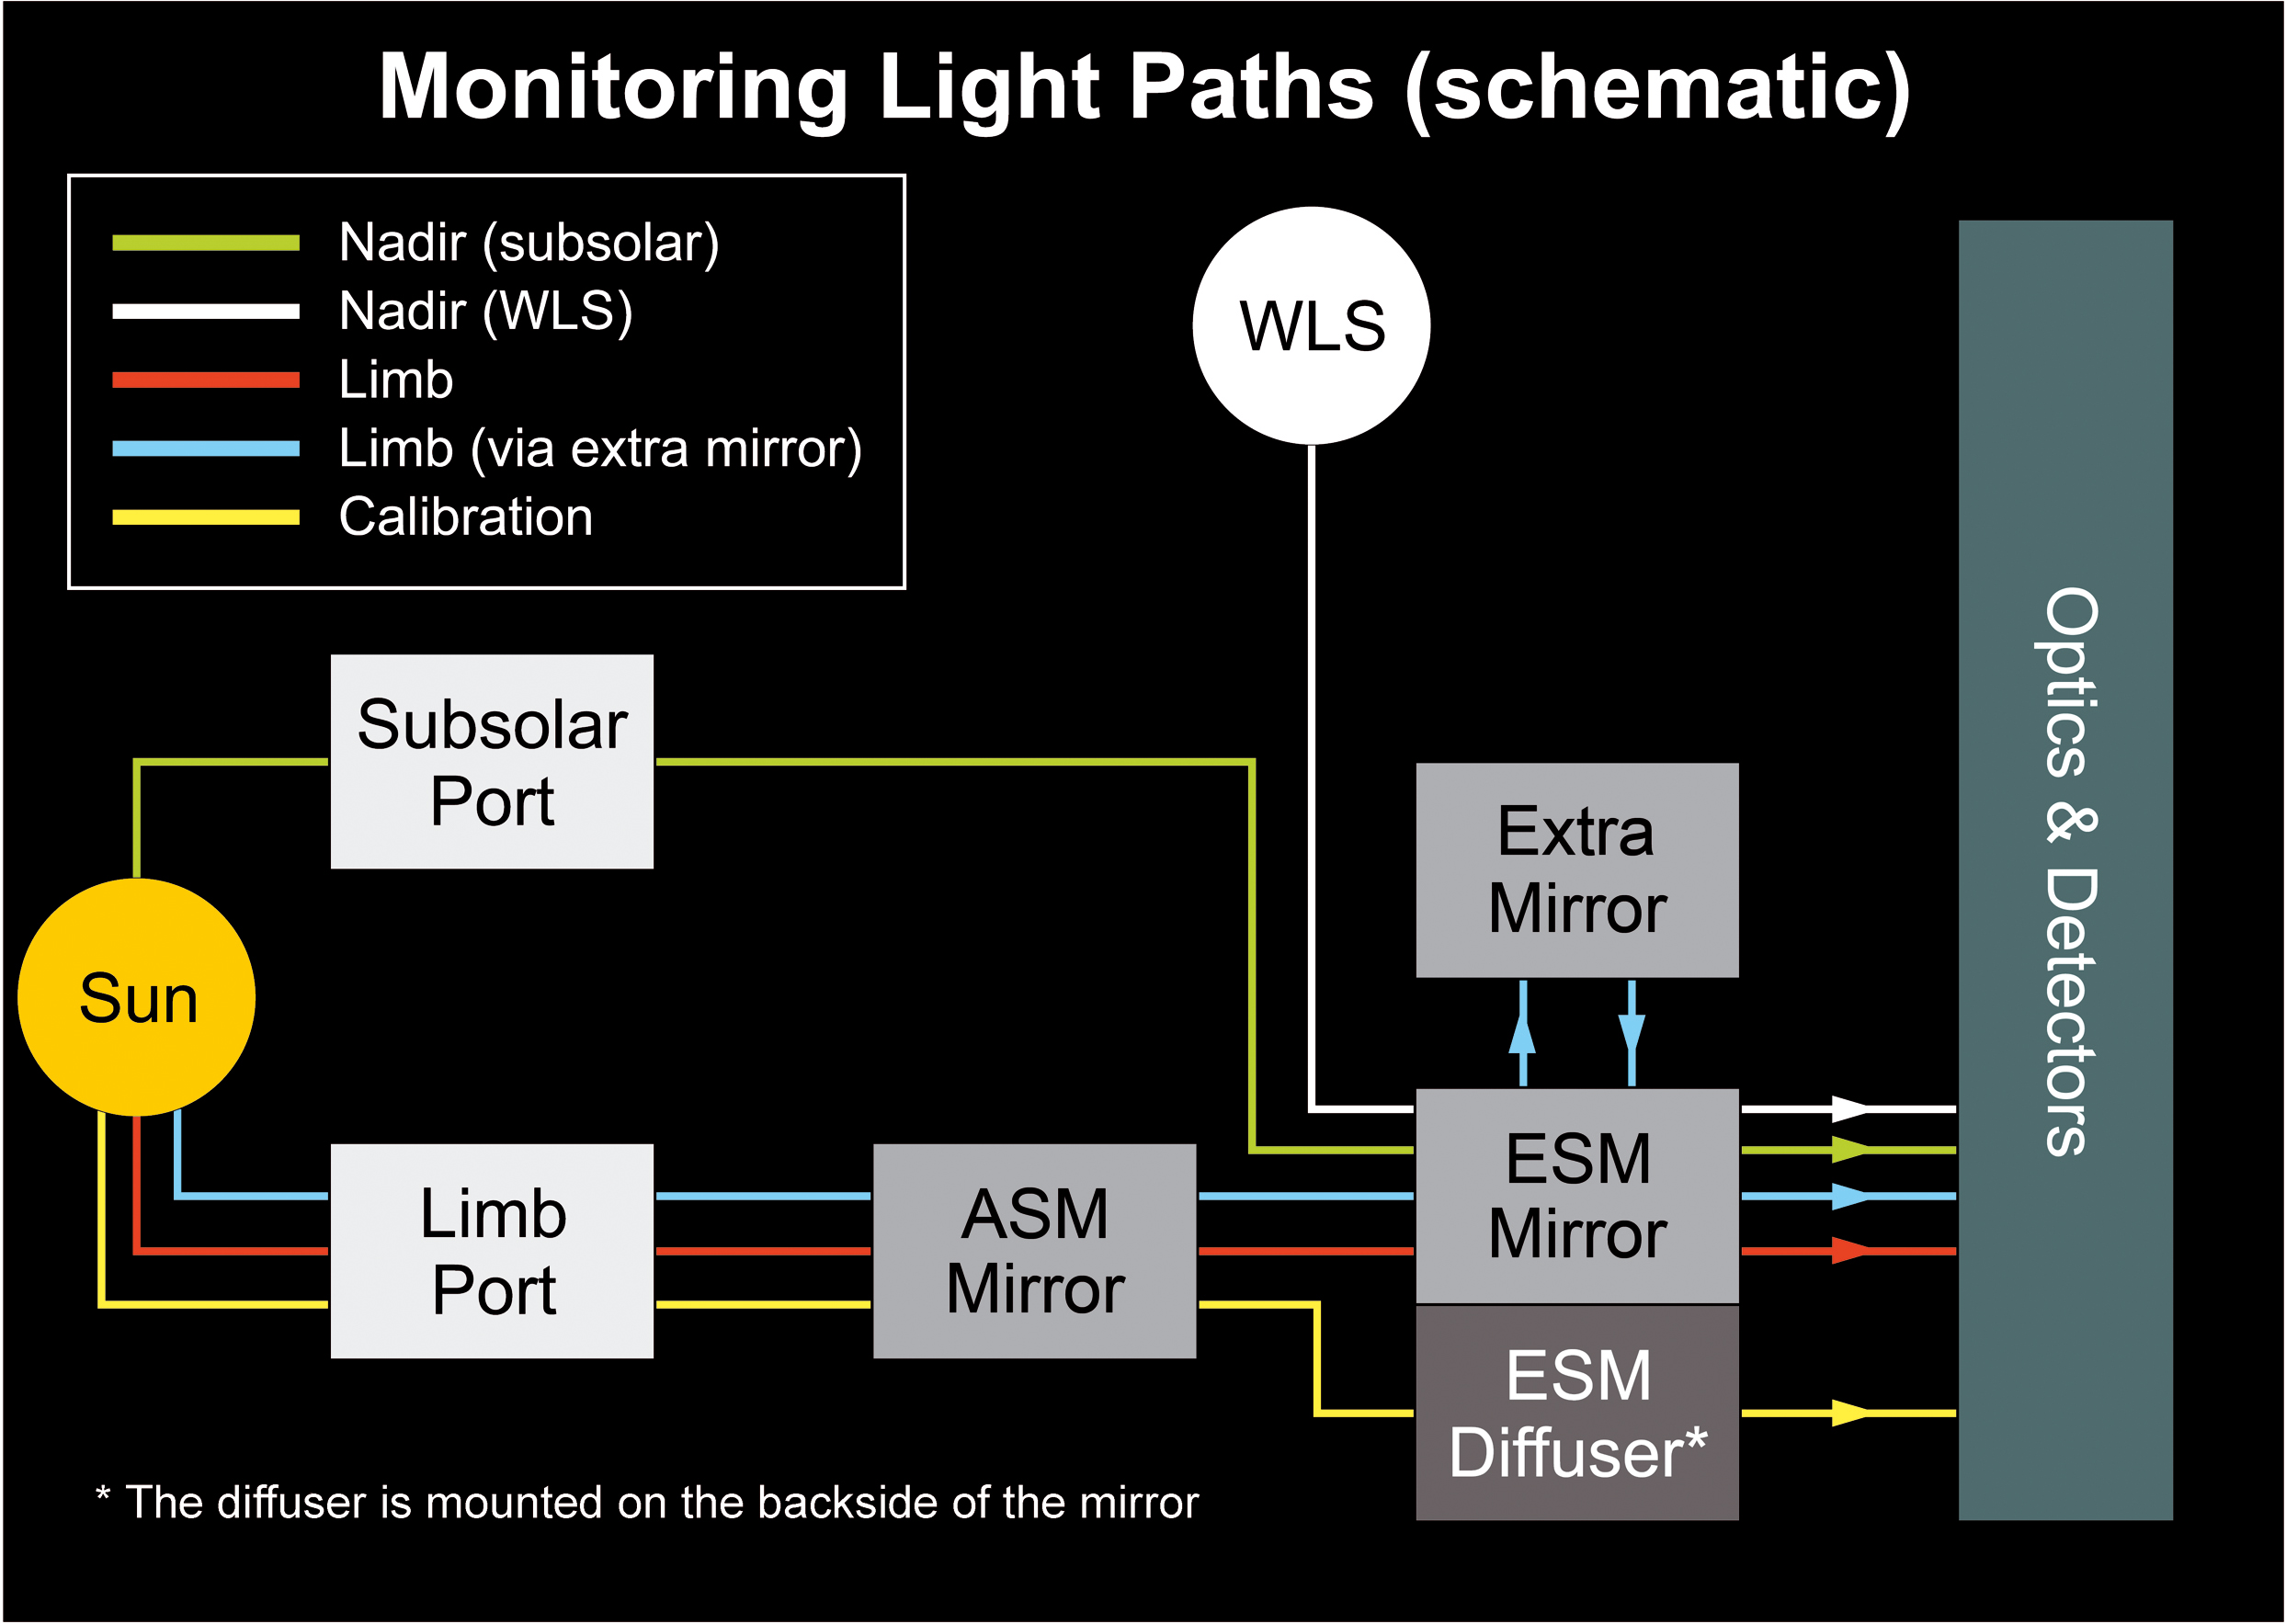
| Fig. 5-6 | Schematic
view of SCIAMACHY light paths used in performance monitoring. (graphics: IUP-IFE, University
of Bremen) |
|
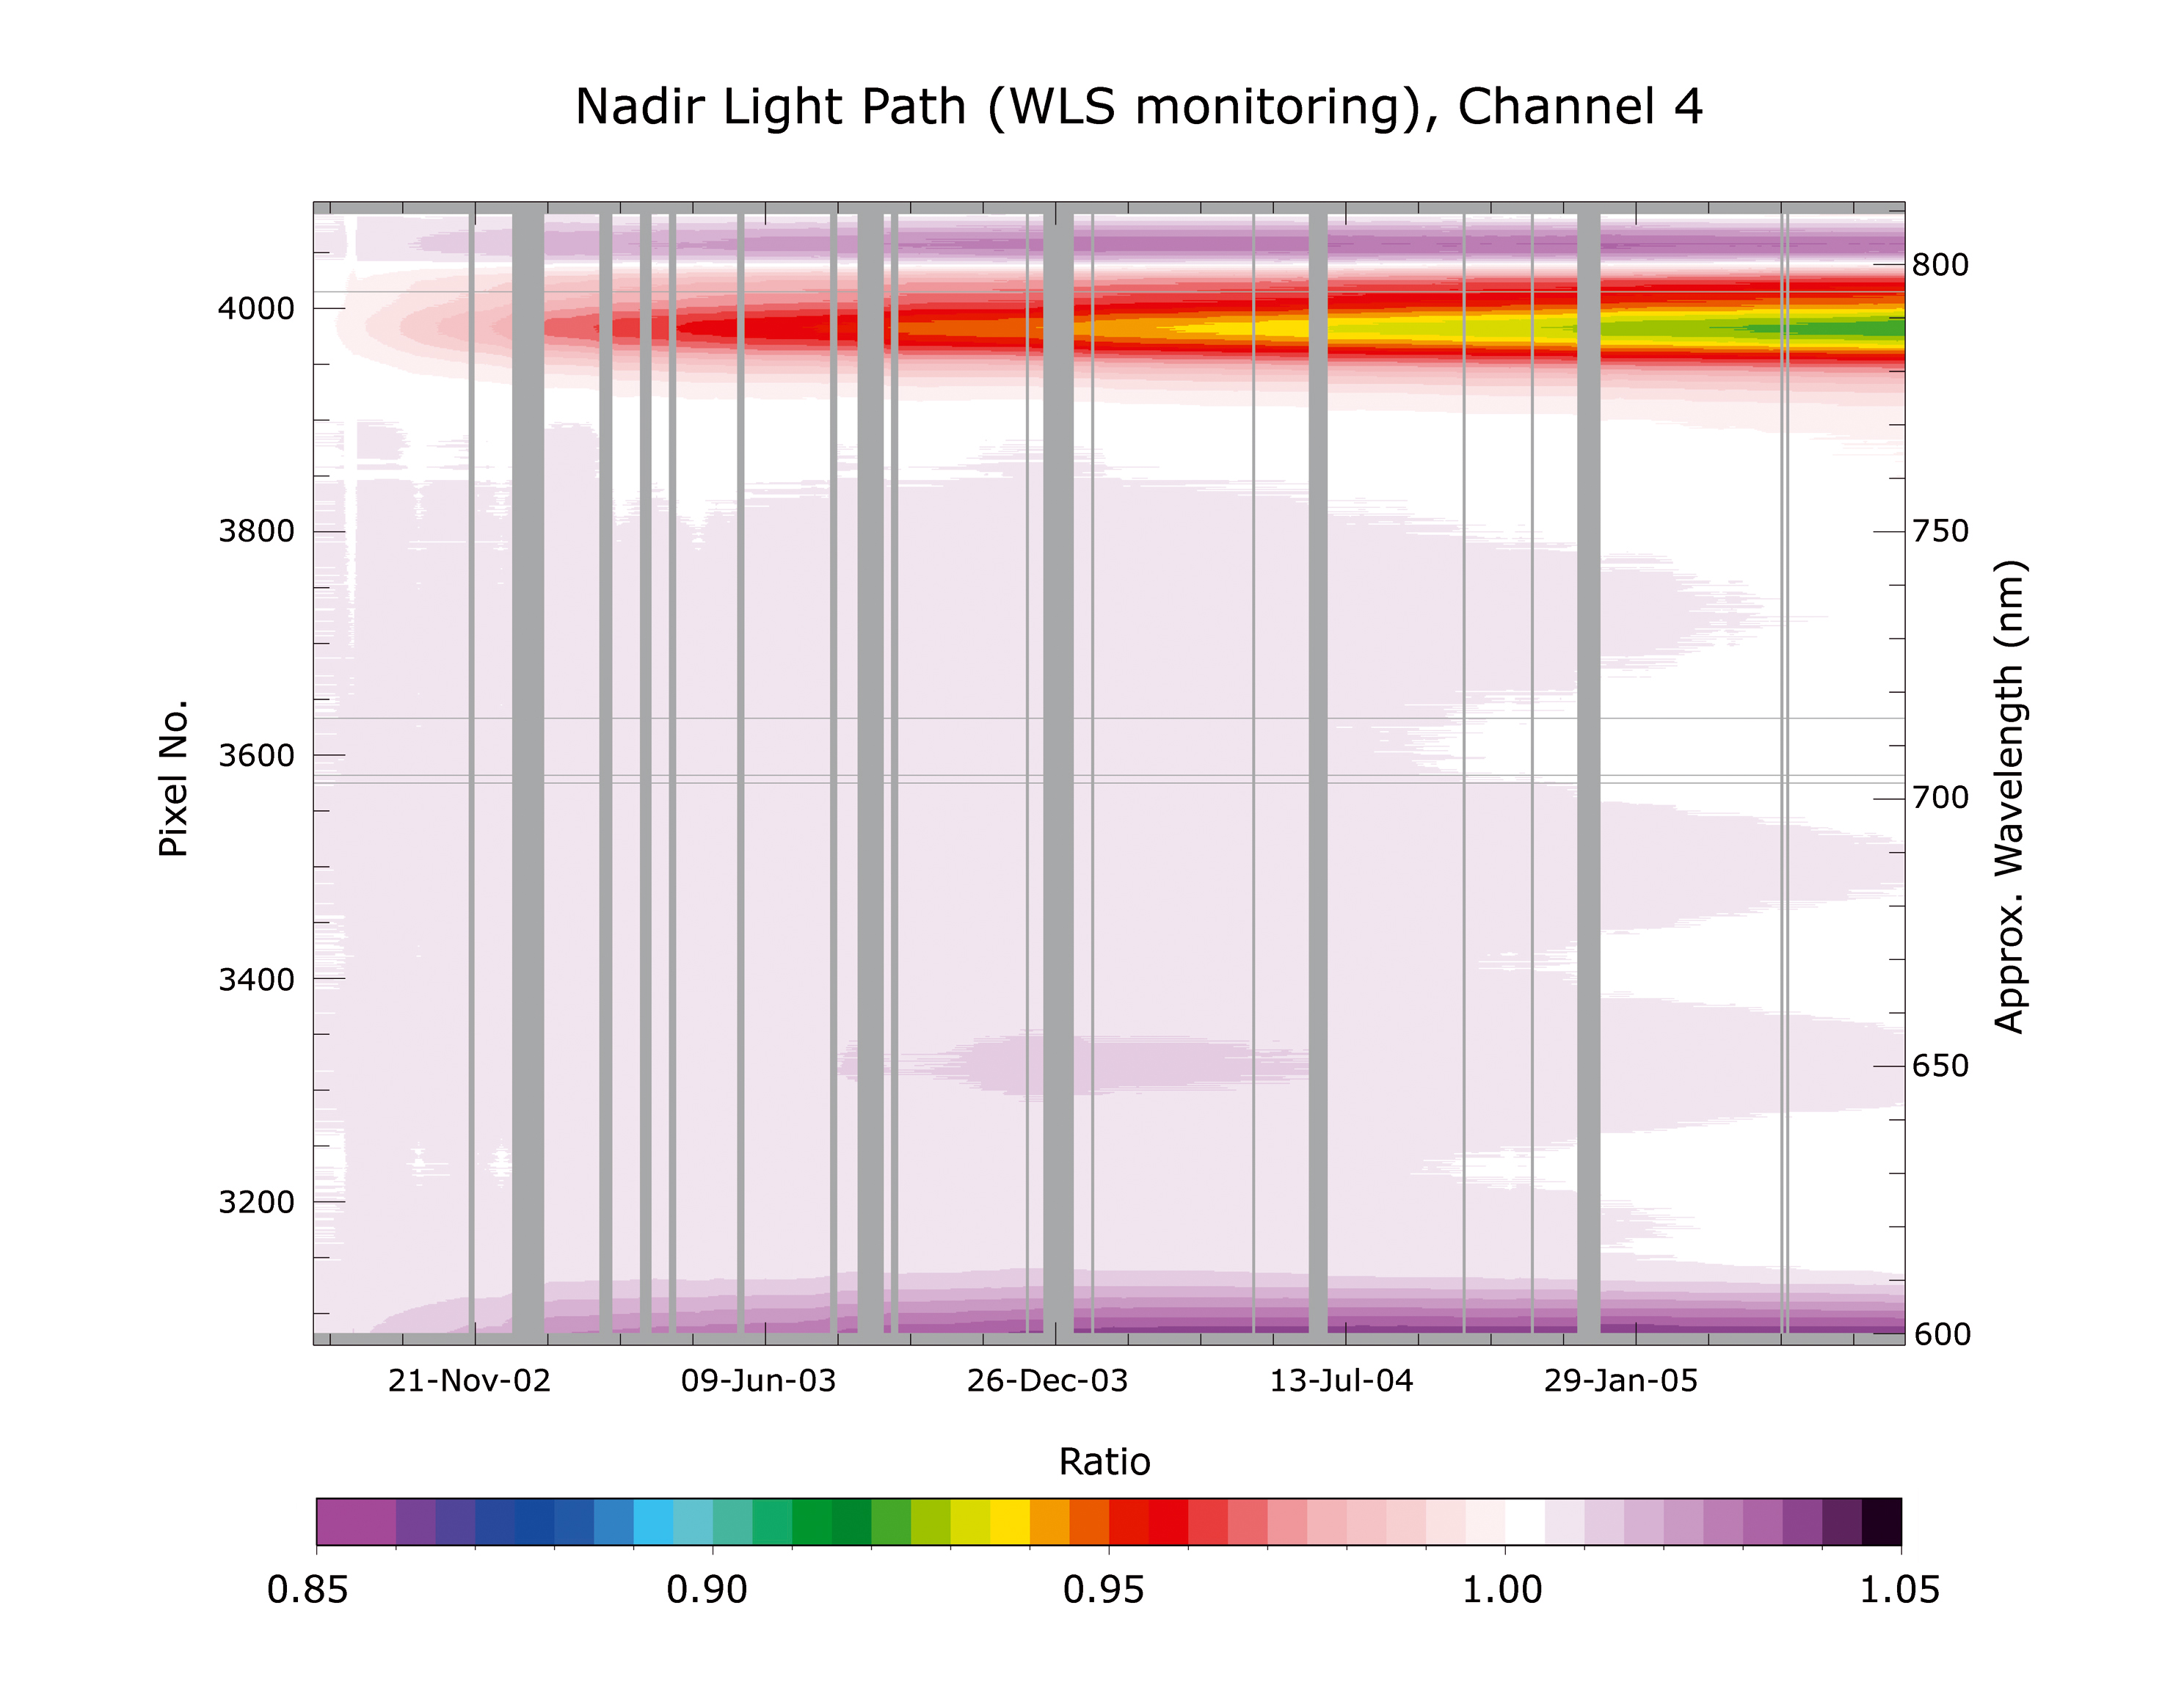
| Fig. 5-7 | Monitoring
results for the nadir light path using measurements with the
internal WLS in channel 2. All available data have been interpolated to a daily grid.
(graphics: IUP-IFE, University of Bremen) |

|
| Fig. 5-8 | As
fig. 5-7, but results for channel 4. (graphics: IUP-IFE, University of
Bremen) |
|
Page generated 26 March 2007