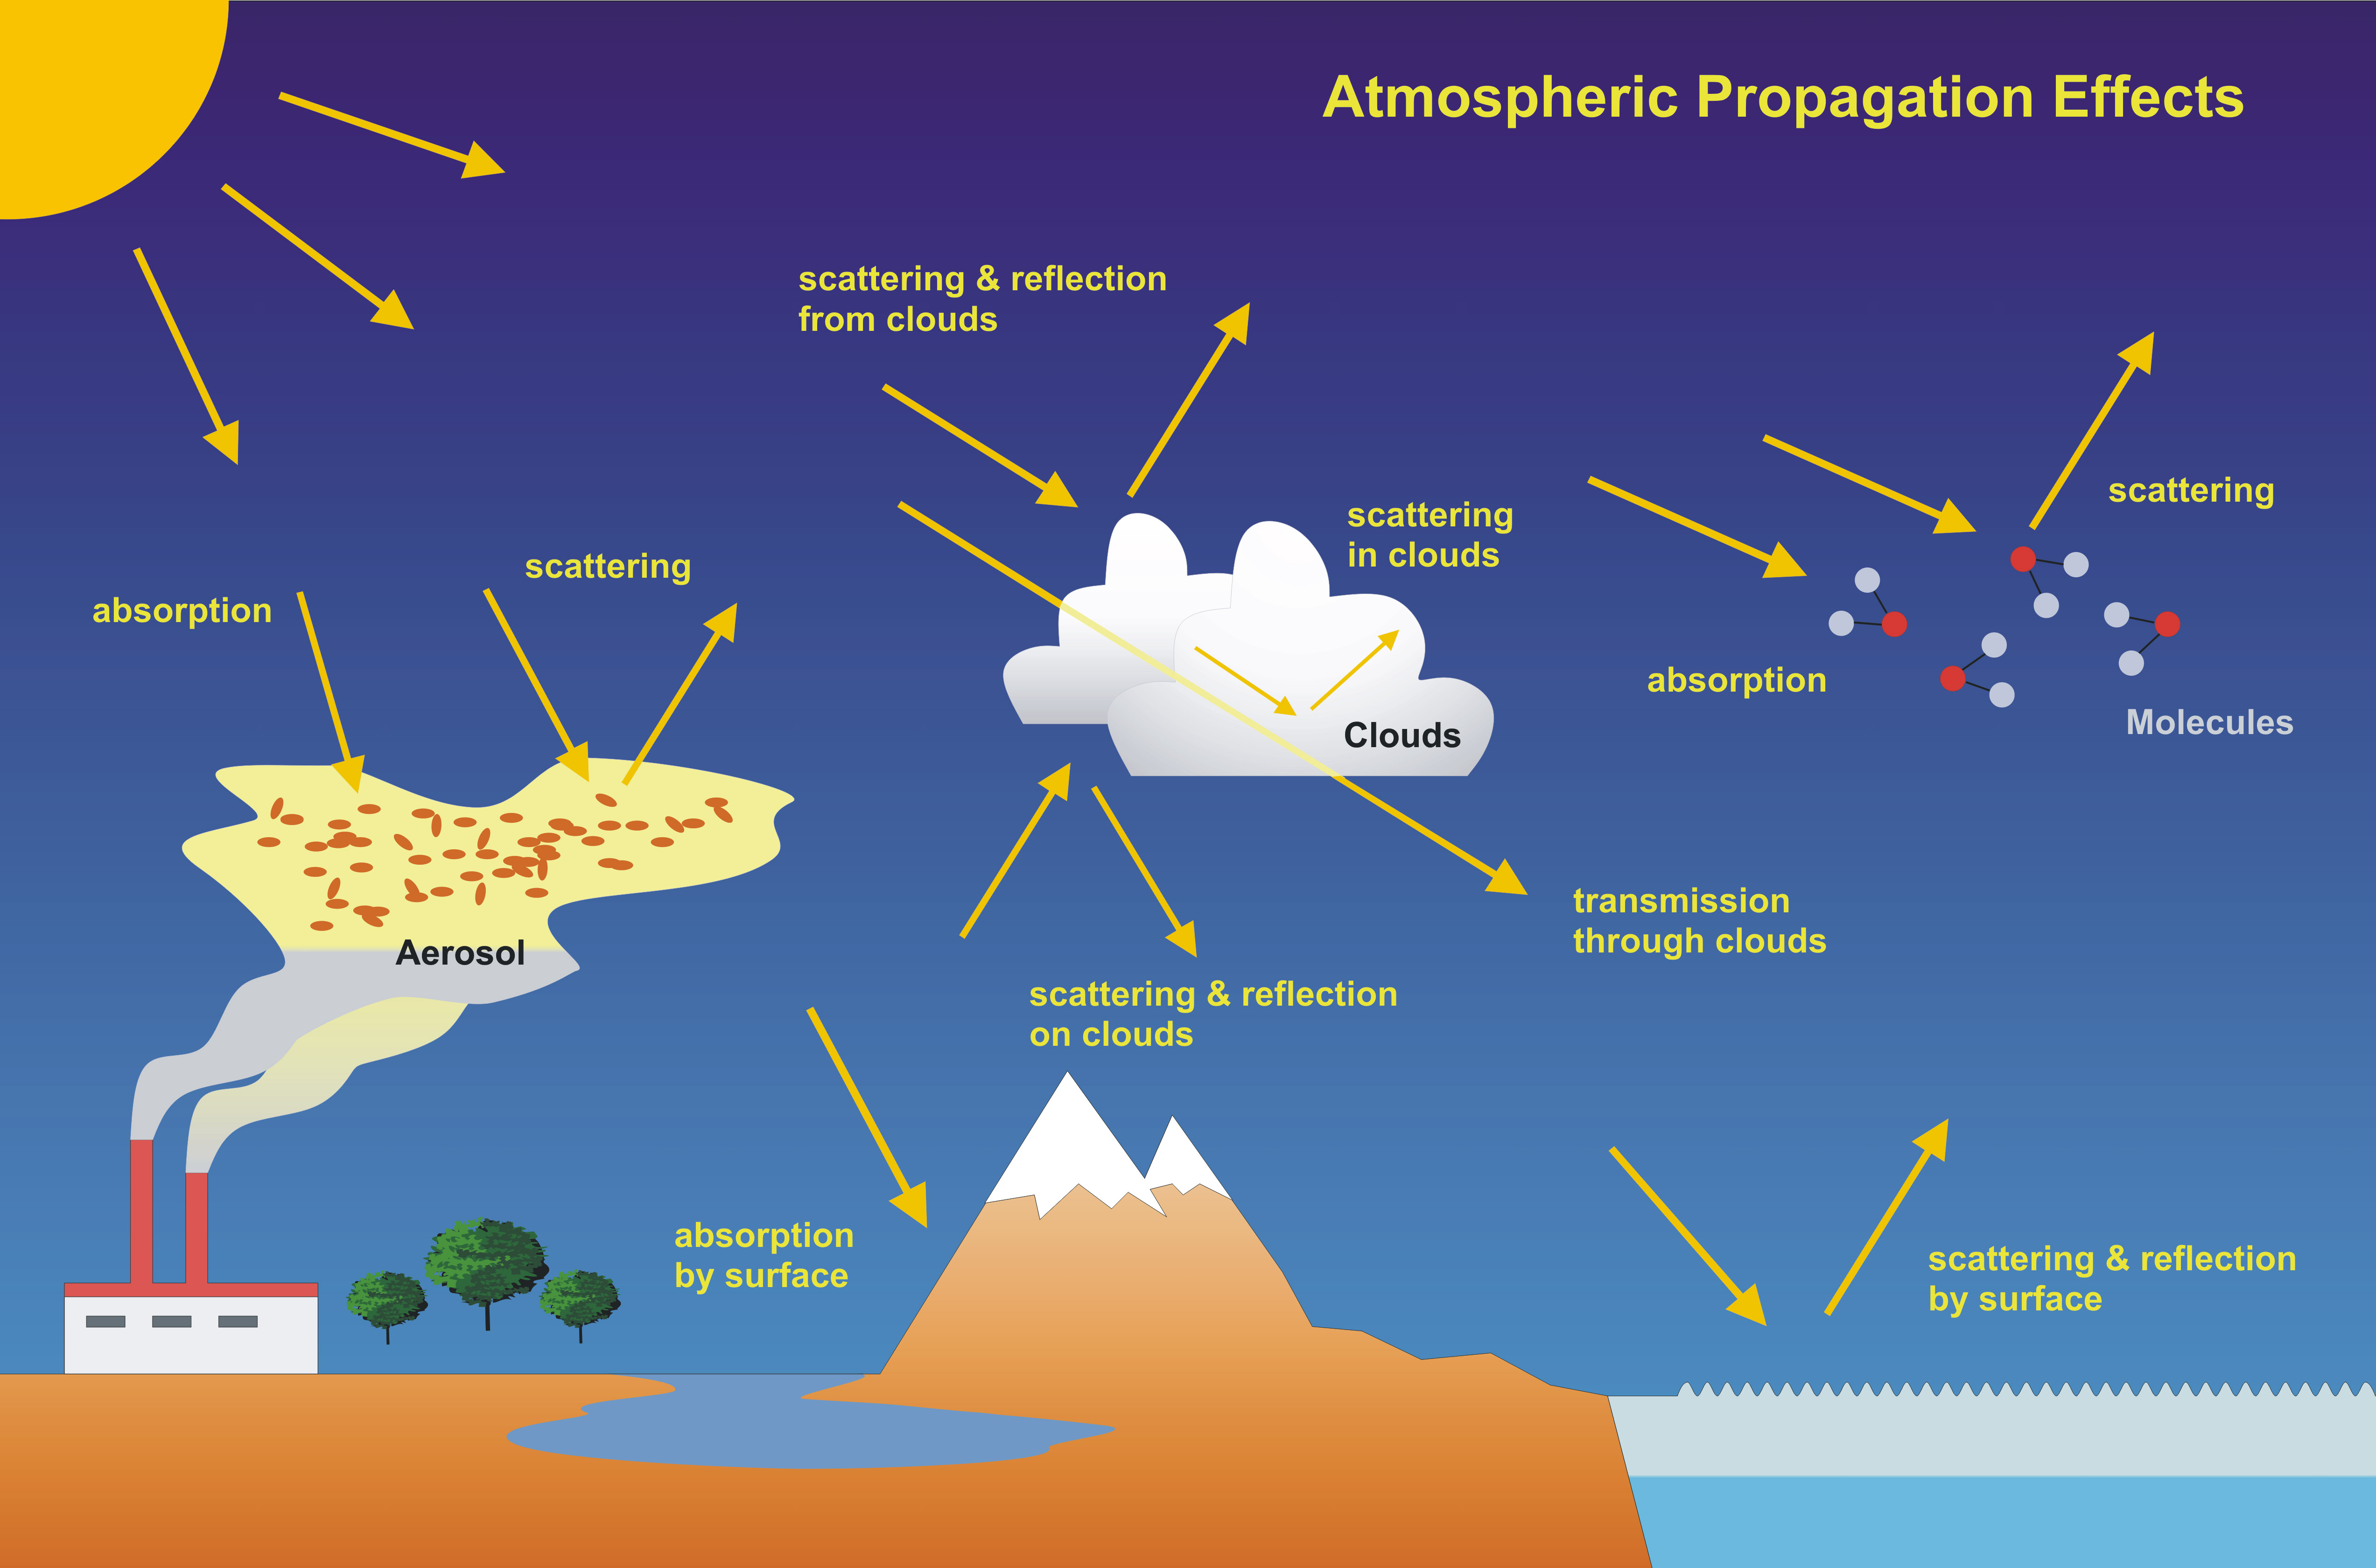
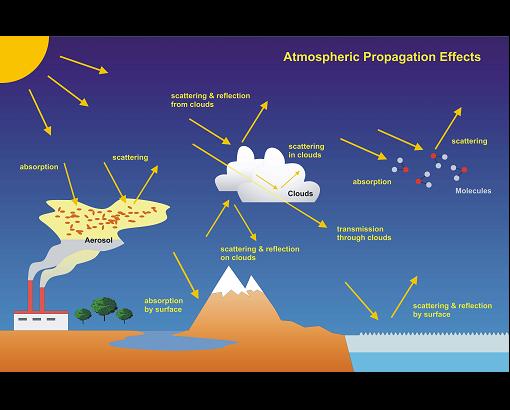
| Fig.
7-1 |
Scheme of the relevant interactions of solar light with the Earth's atmosphere and surface.
Courtesy: DLR-IMF)
|
|
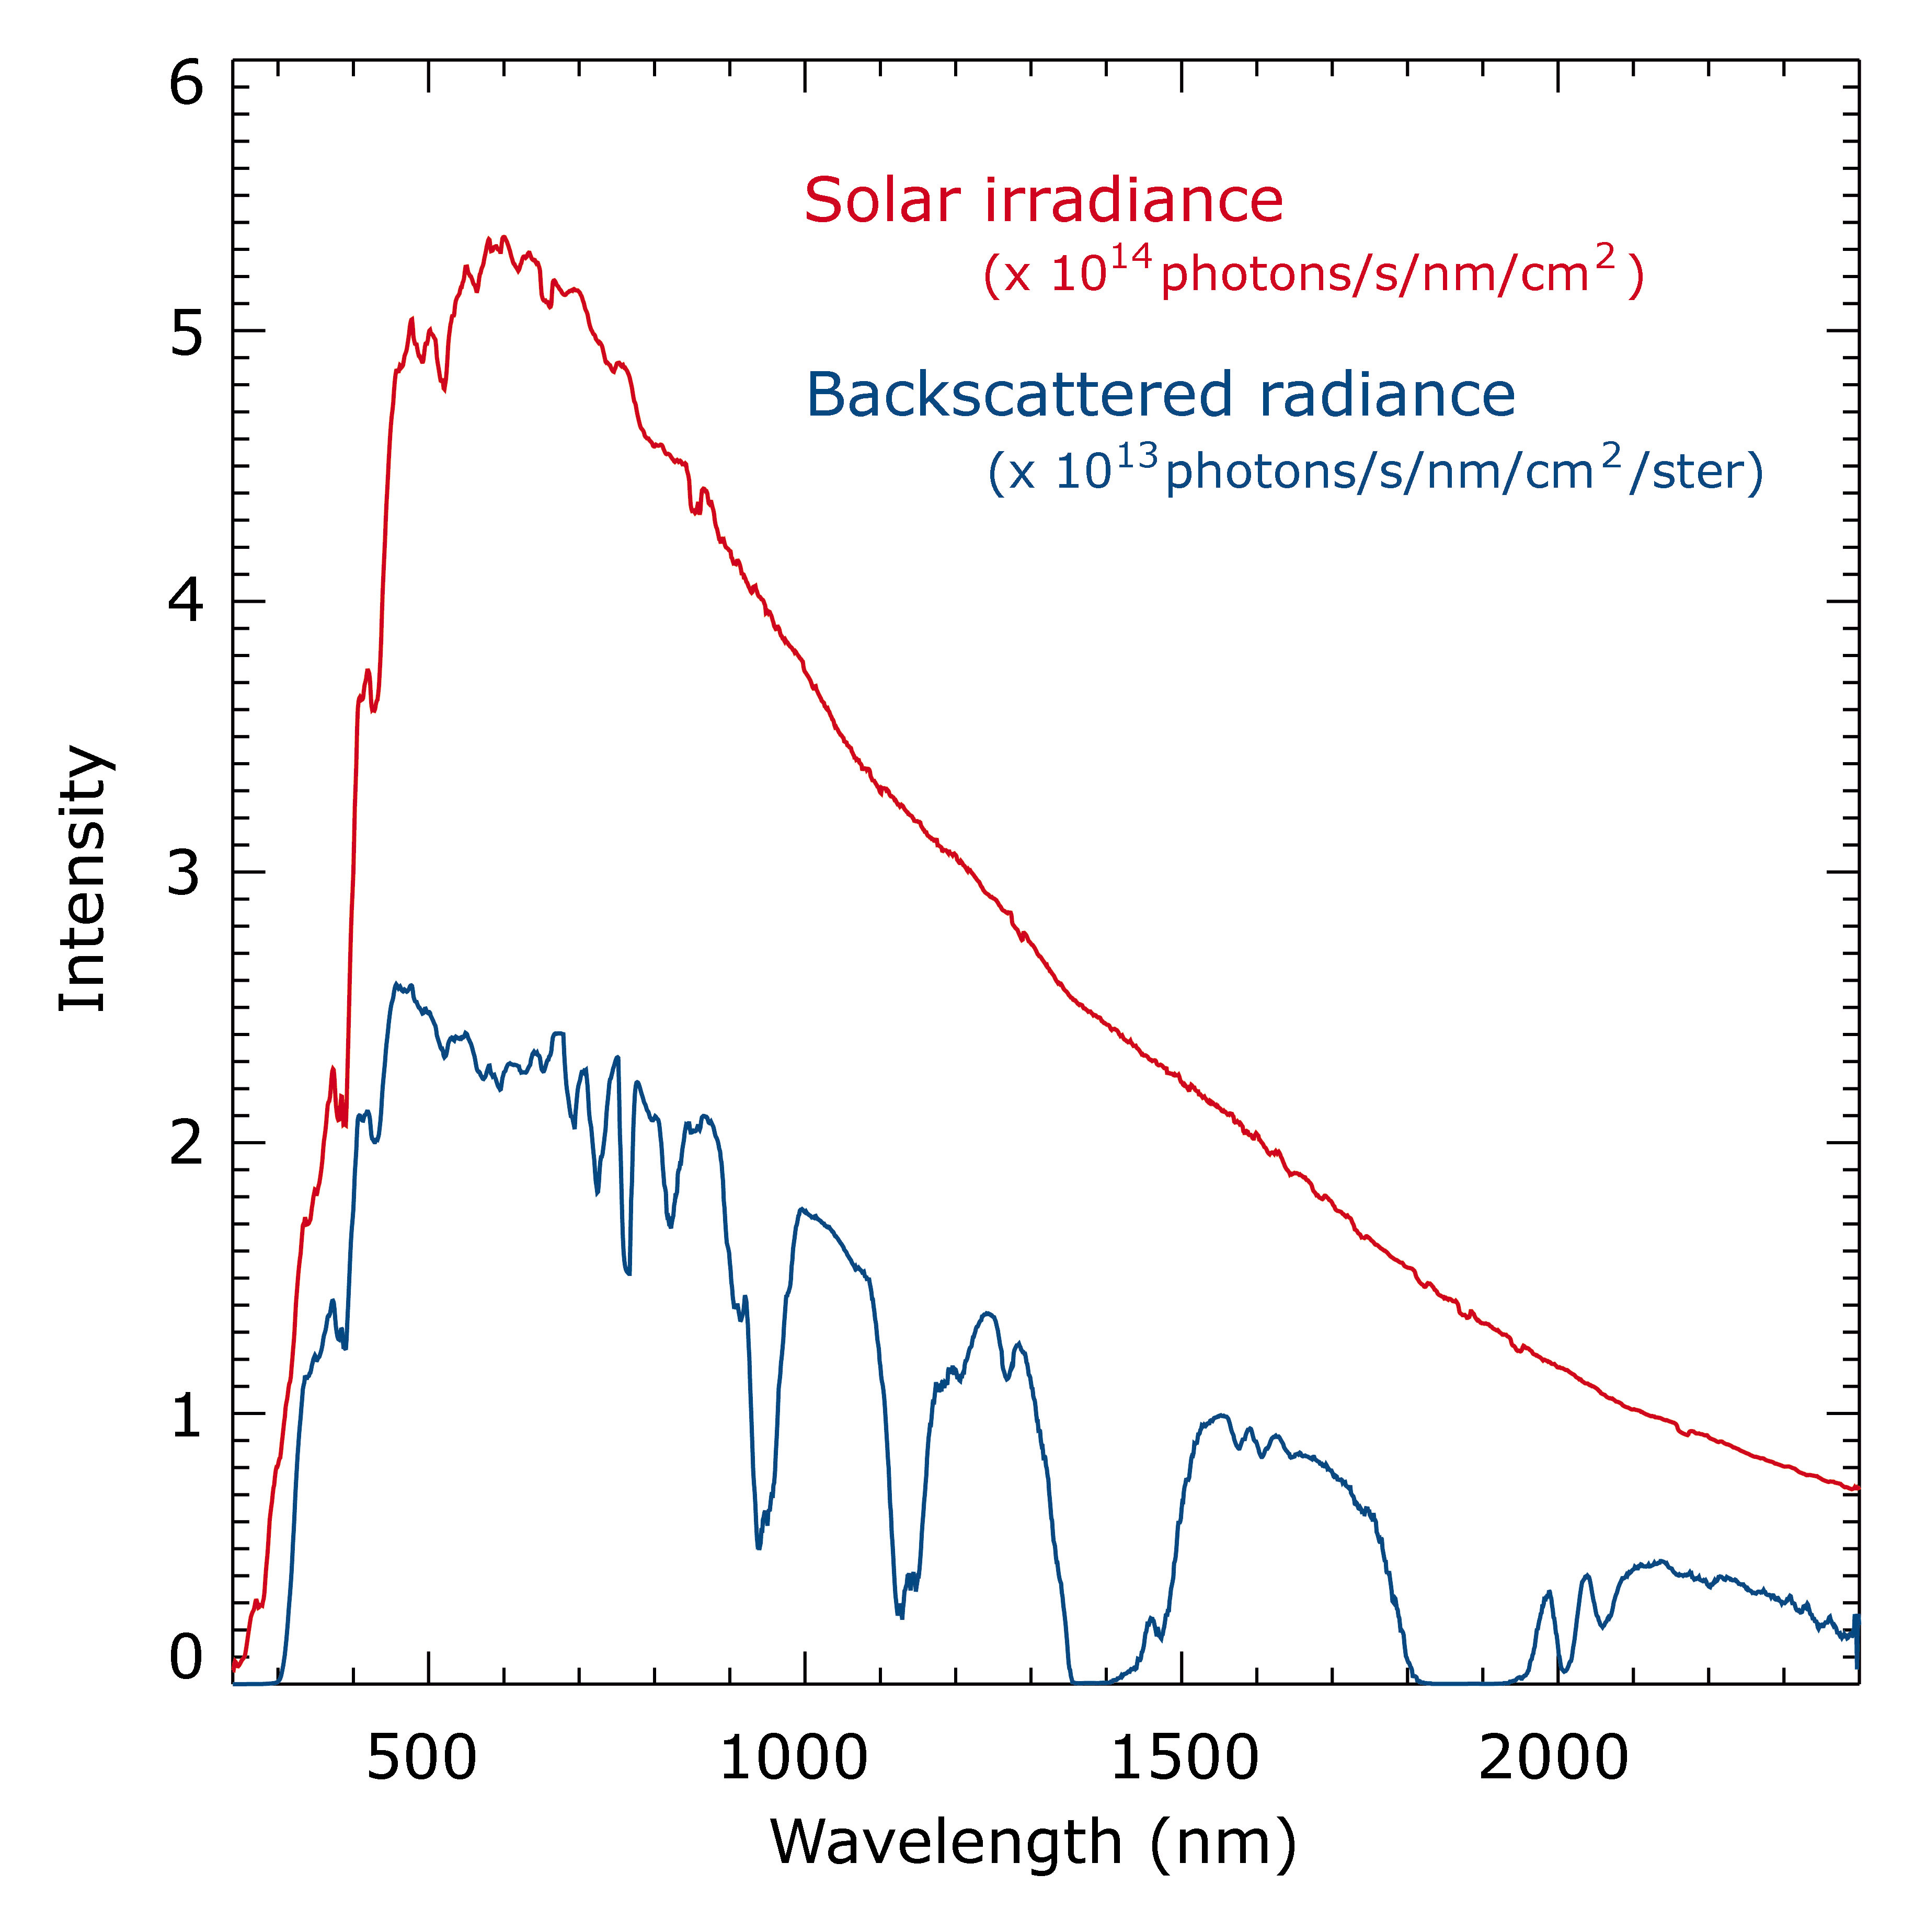
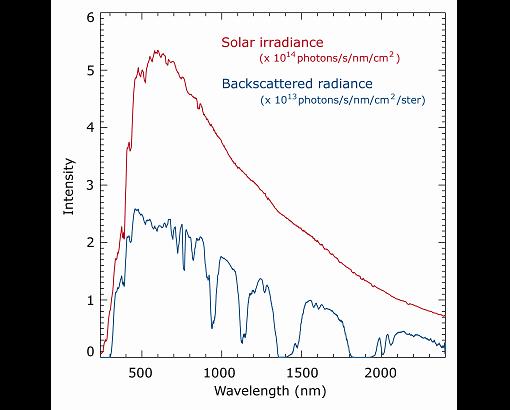
| Fig.
7-2 |
The solar irradiance spectrum (red) and Earth radiance spectrum (blue) with a shape modified by absorption of trace
gases and scattering in the atmosphere. (Courtesy: IUP-IFE, University of Bremen)
|
|
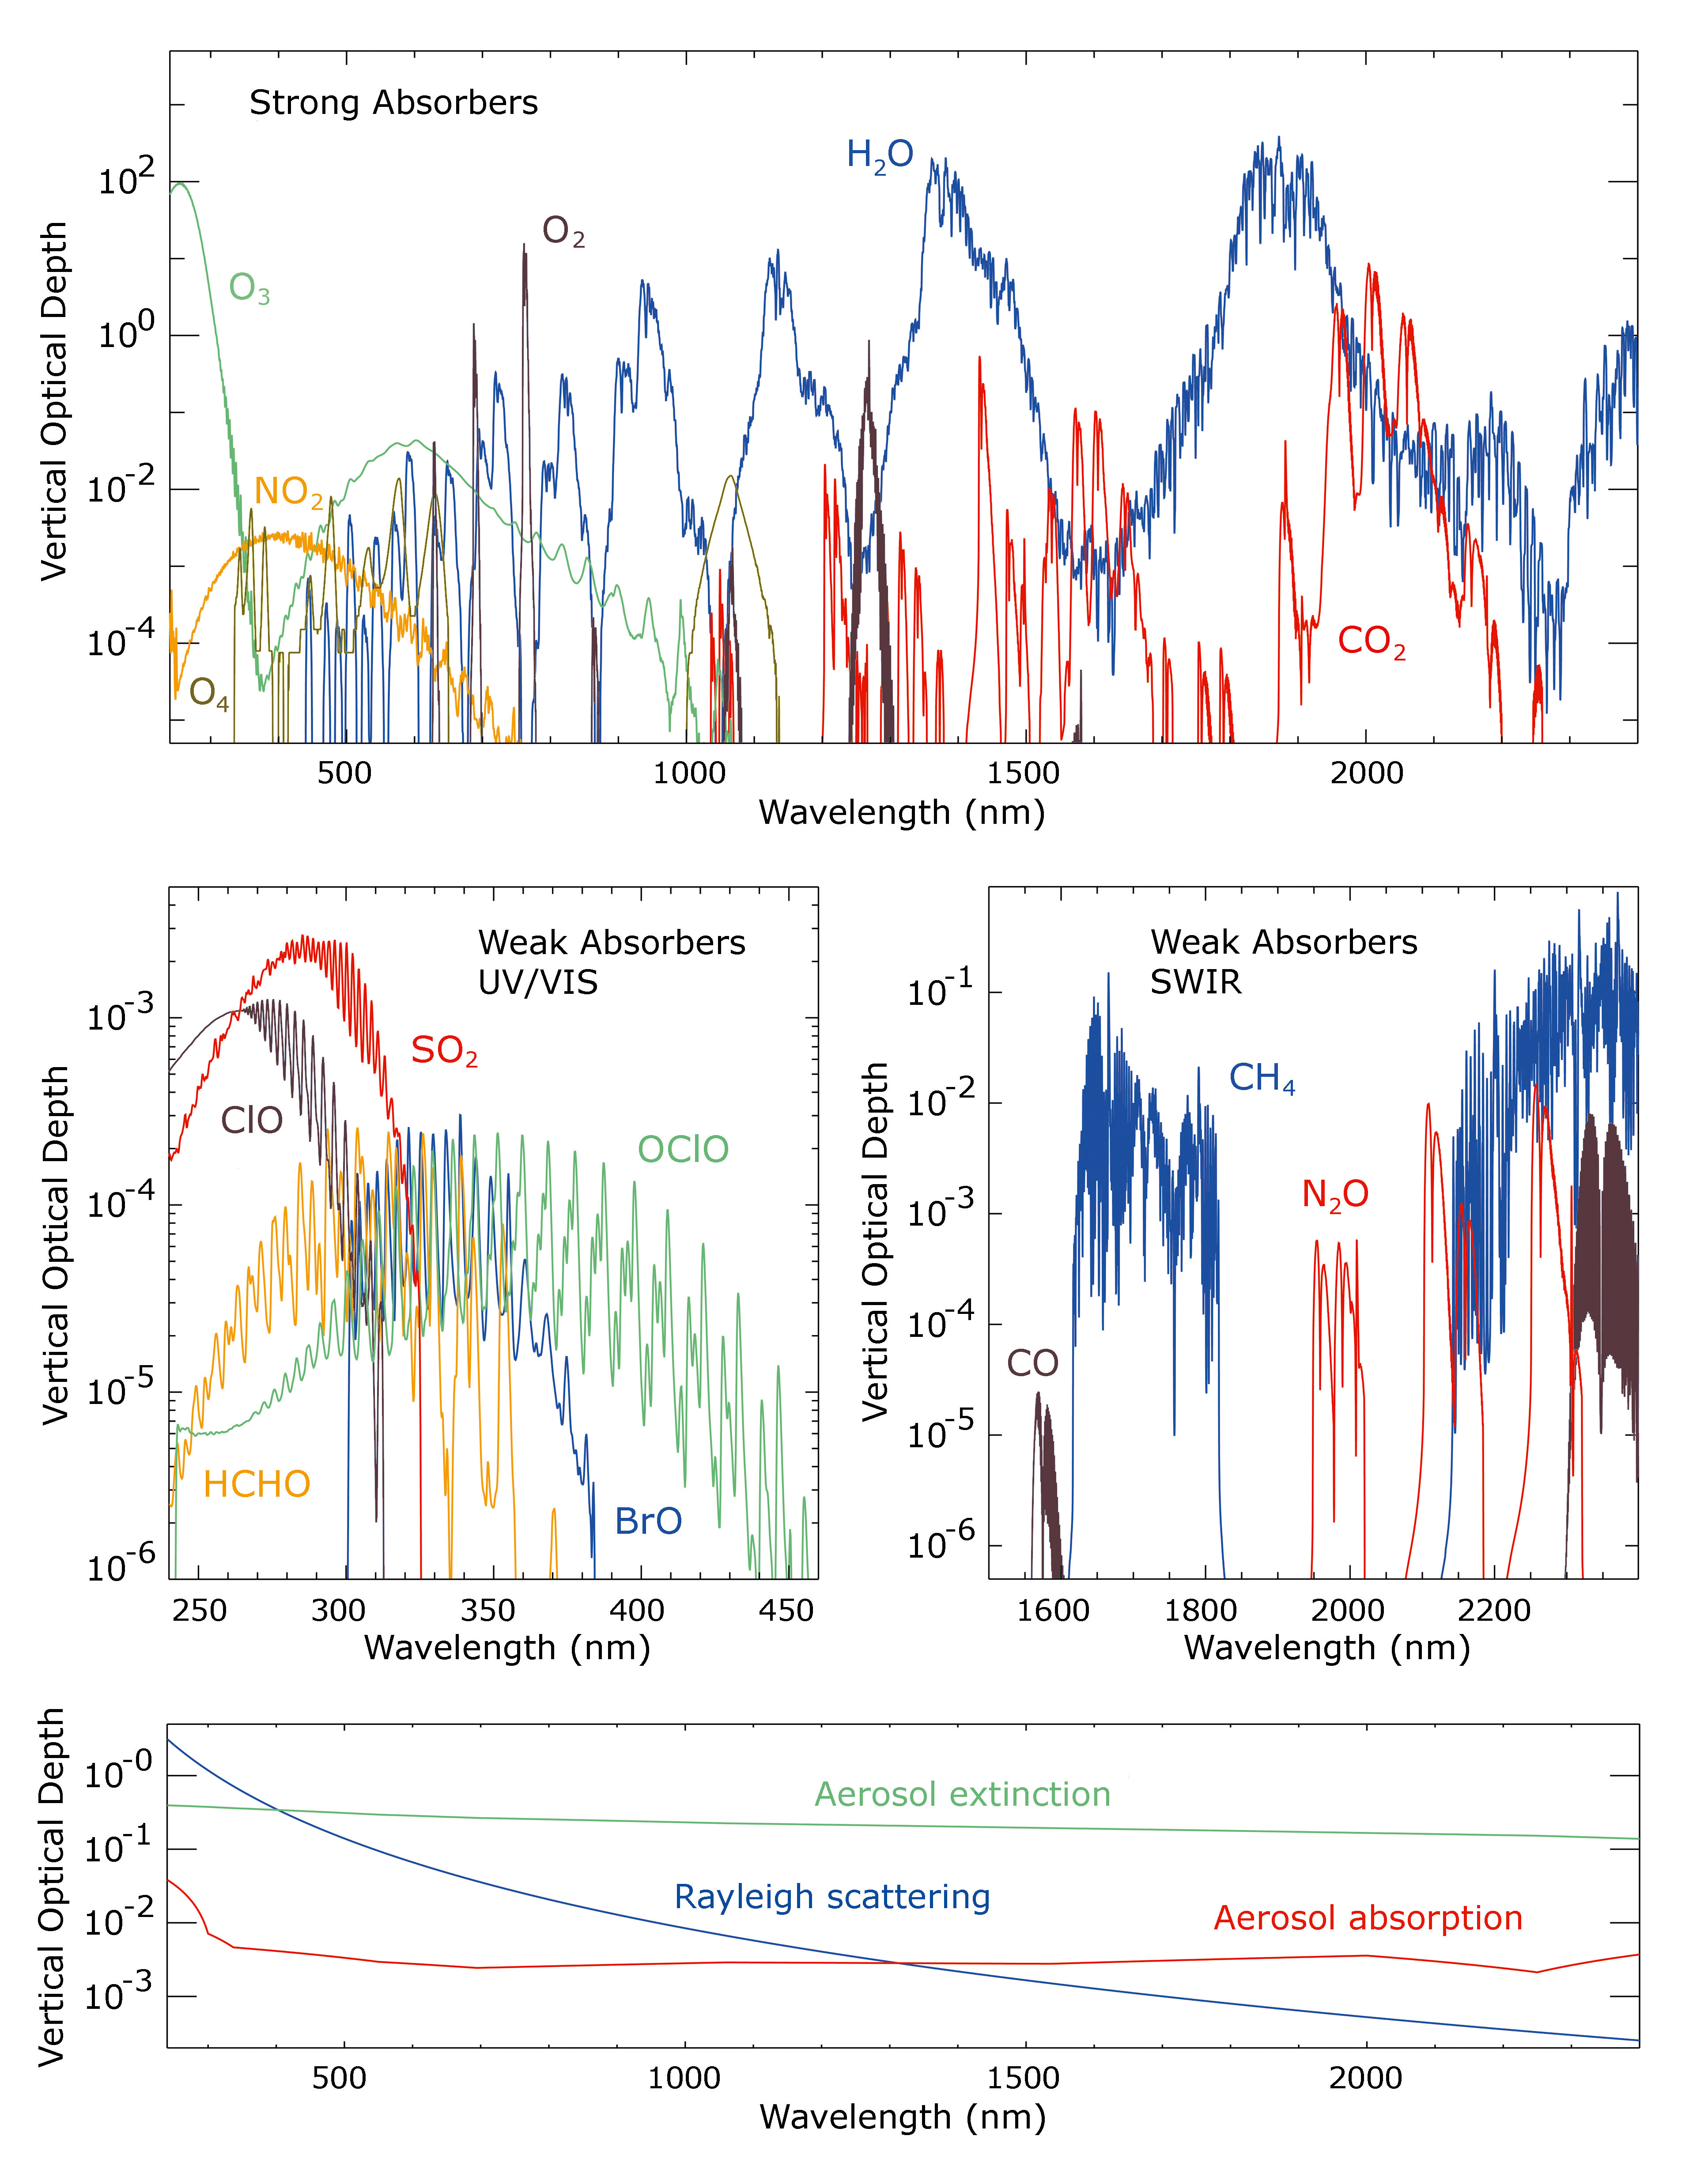
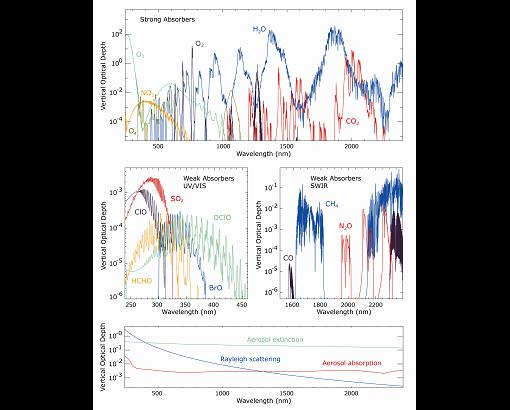
| Fig.
7-3 |
Simulated vertical optical depth of the targeted constituents for 55°N around 10 a.m.
The strong absorbers are plotted in the upper part and the relevant weak absorbers in the middle part.
In the lower part, the vertical optical depth due to Rayleigh scattering, aerosol extinction and absorption is given.
Note the large dynamic range of the differential absorption structures used for retrieval of the constituents.
(Courtesy: IUP-IFE, University of Bremen)
|
|
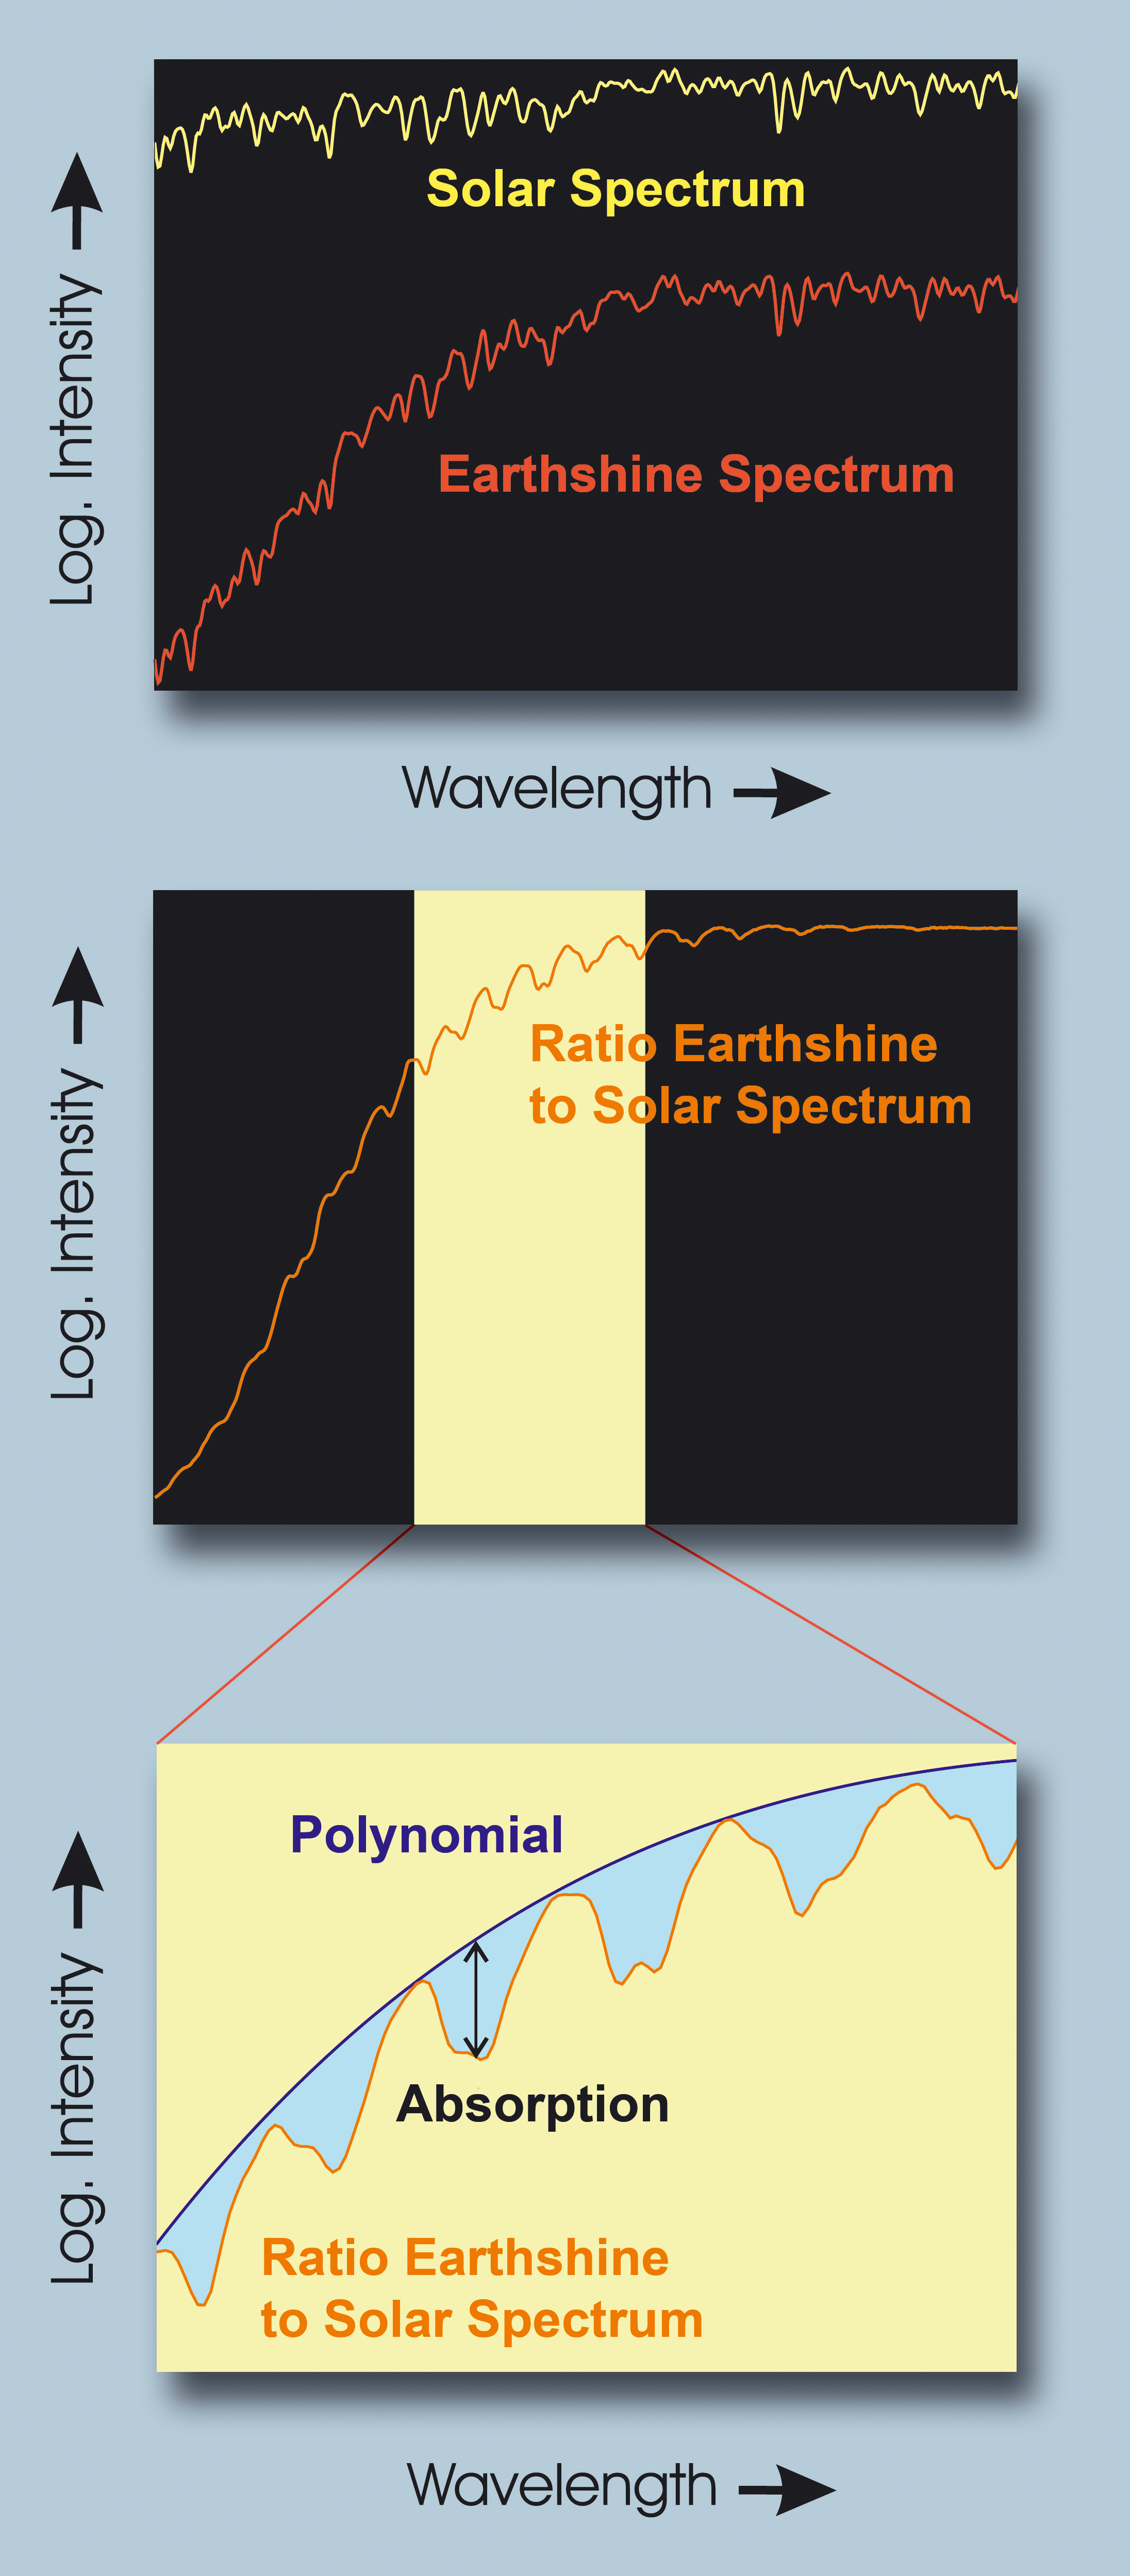
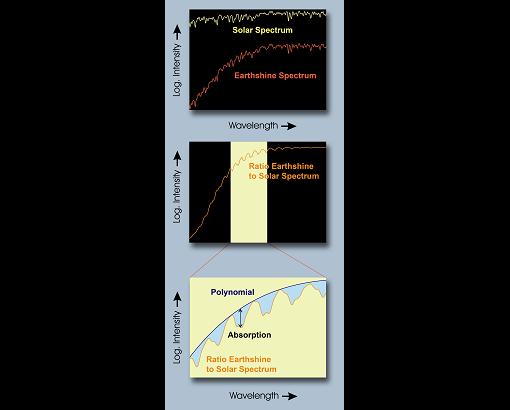
| Fig.
7-4 |
The main steps of the DOAS retrieval. For further details see the text.
(Courtesy: IUP-IFE, University of Bremen)
|
|
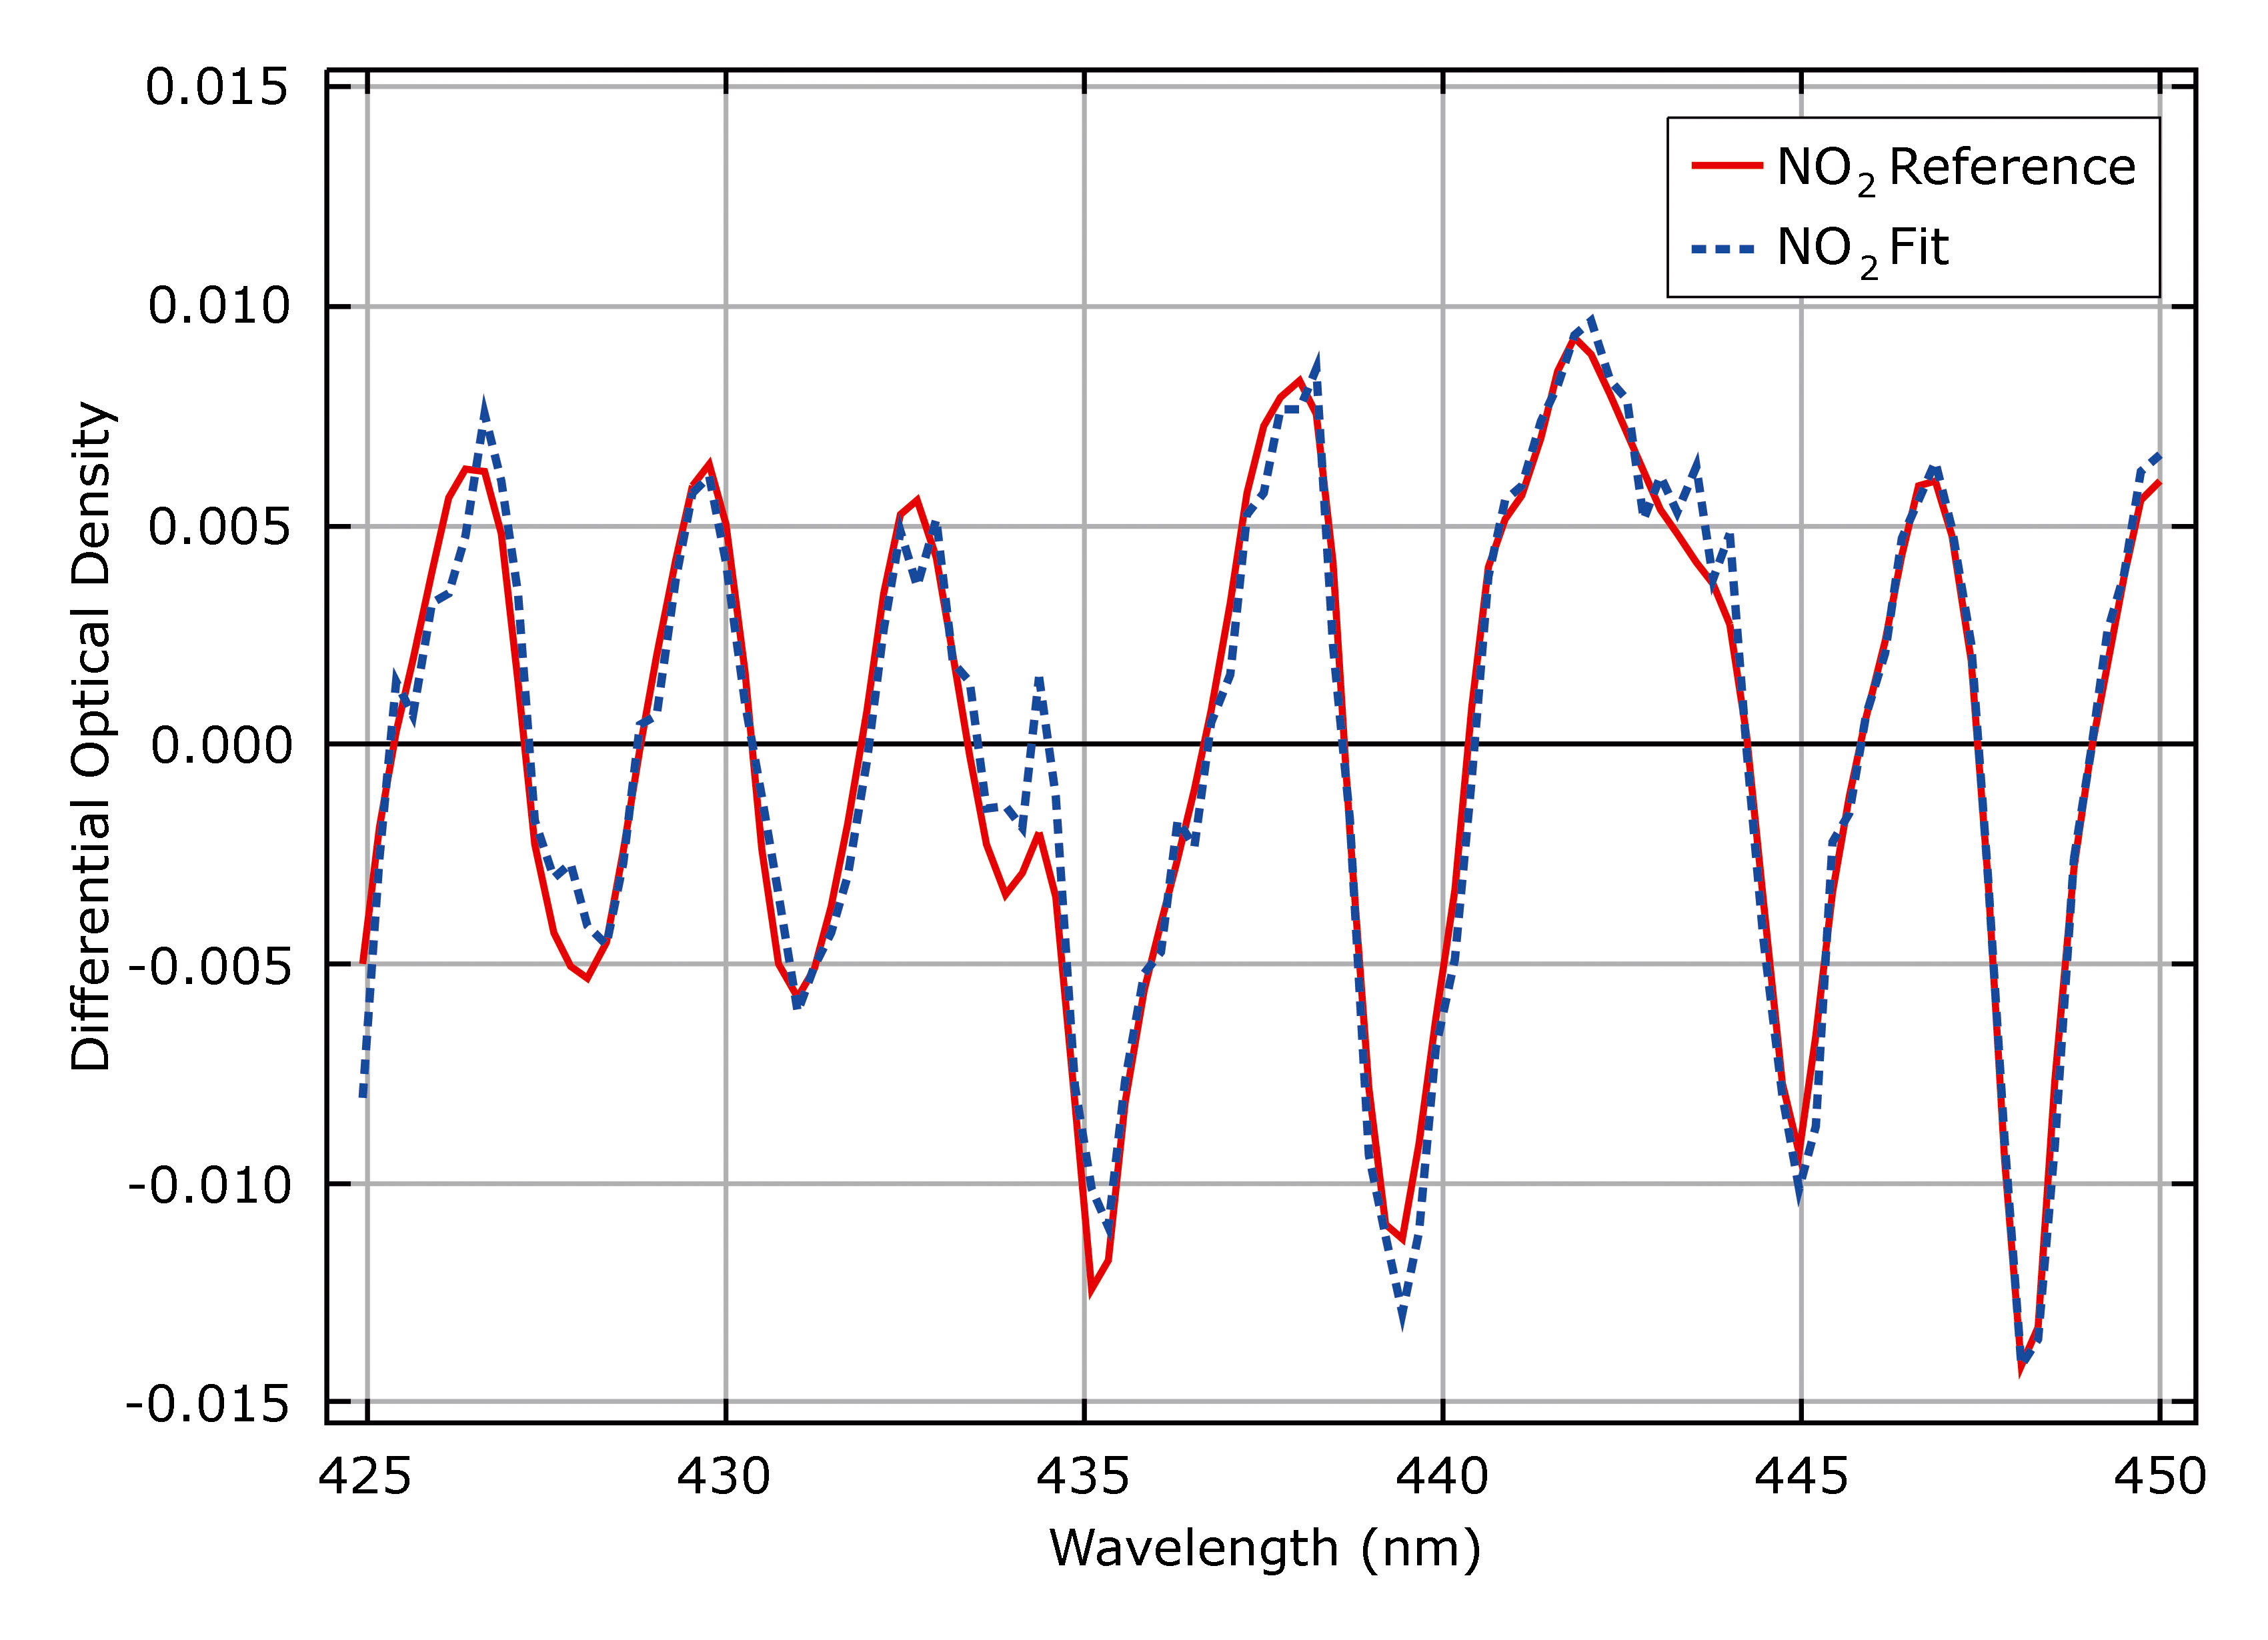
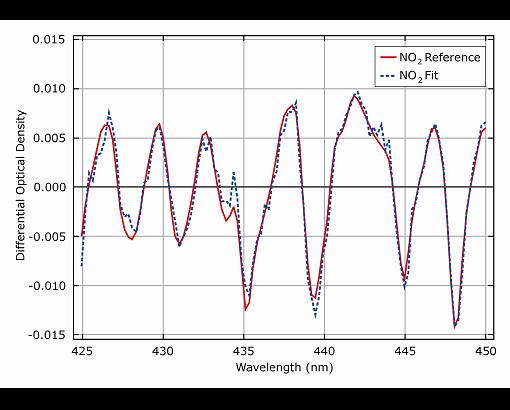
| Fig.
7-5 |
Typical SCIAMACHY NO2 fit results from a measurement over a polluted area in China on 15 January 2006.
The red line is the scaled NO2 laboratory cross section, the dashed blue line the result of the fit after
subtraction of all contributions with the exception of NO2. (Courtesy: IUP-IFE, University of Bremen)
|
 |
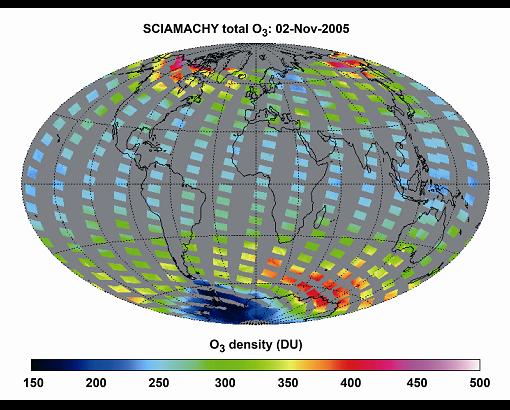
| Fig.
7-6 |
One day of total ozone densities obtained with the TOSOMI algorithm. (Courtesy: KNMI/ESA)
|
 |
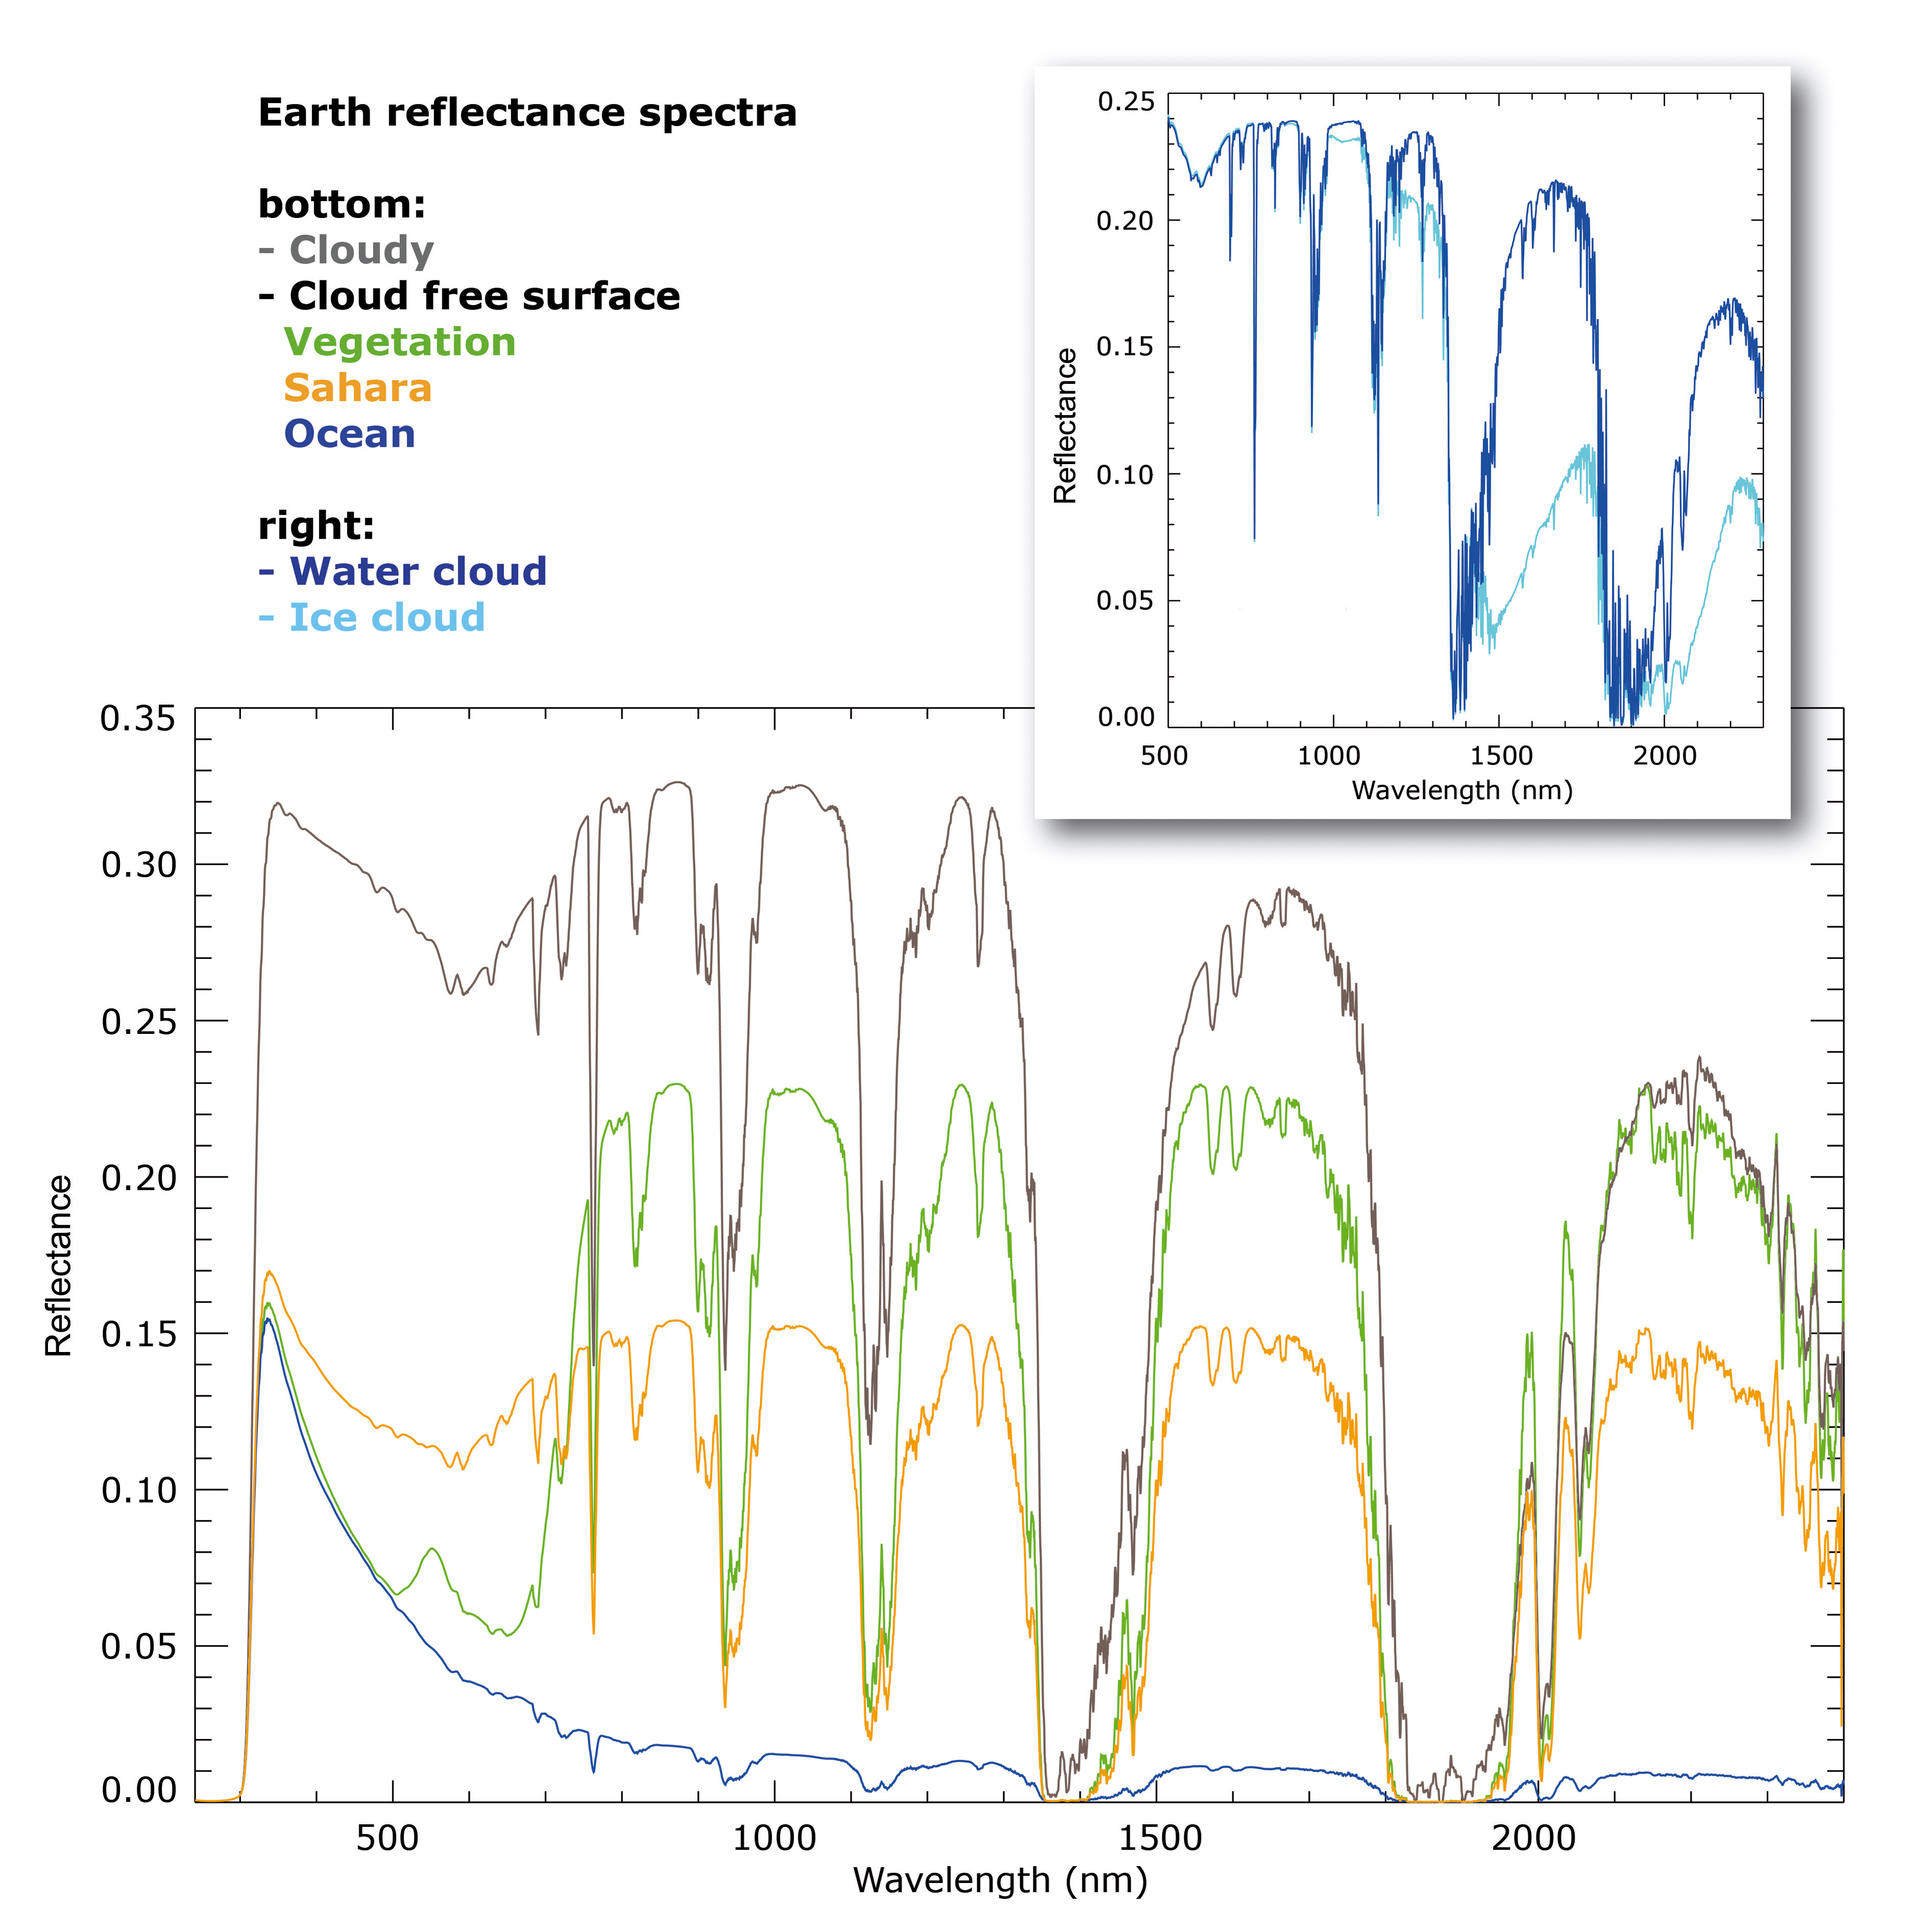
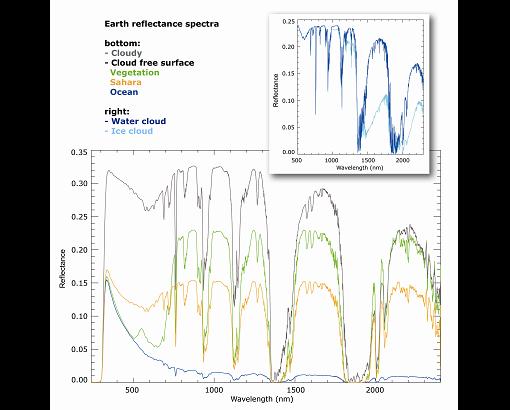
| Fig.
7-7 |
Earth reflectance spectra (Sun normalised intensity) for various cloud and surface conditions.
The inset shows the variation in the reflectance spectrum due to changes in the thermodynamic state
of water in the cloud from liquid water to ice. The large difference in the reflectance spectrum around
1600 nm for ice and water clouds is used to derive information on the thermodynamical state of water in clouds.
(Courtesy: IUP-IFE, University of Bremen)
|
|
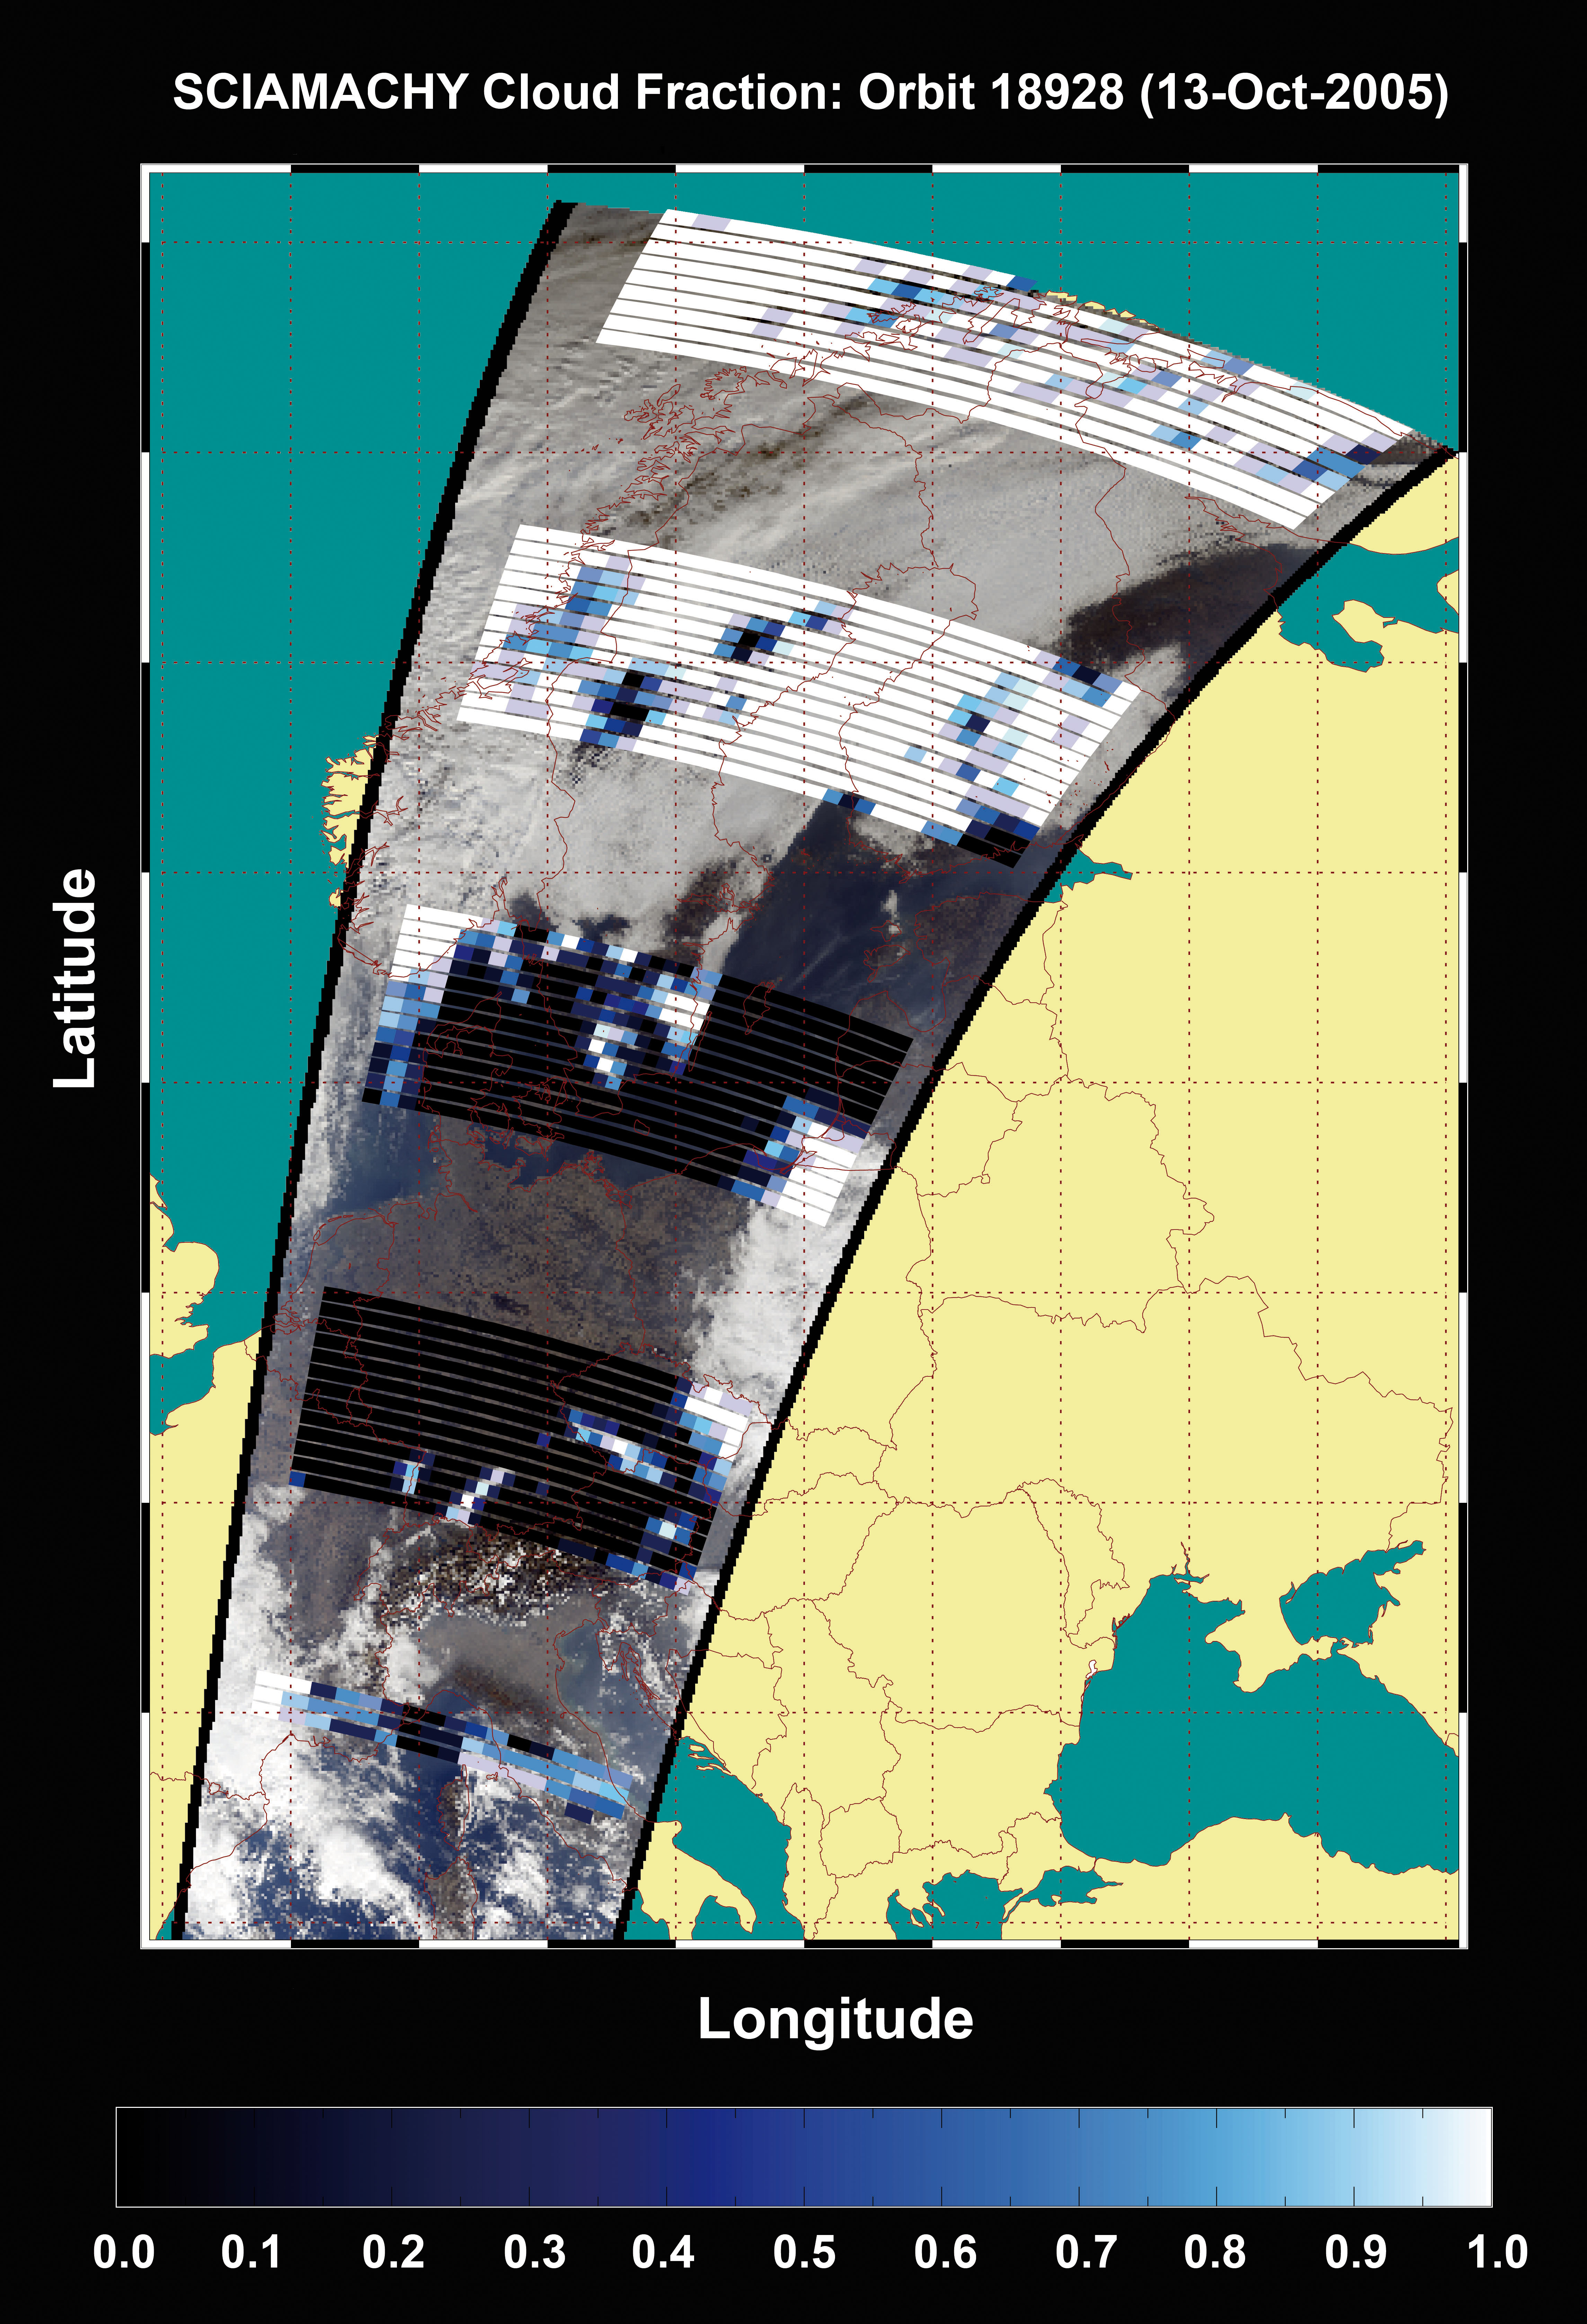
| Fig.
7-8 |
Clouds over Europe on 13 October 2005. Cloud cover as seen in a RGB composite from
MERIS with an overlay of the cloud fraction from SCIAMACHY. (Courtesy: C.Schlundt, IUP-IFE)
|
 |
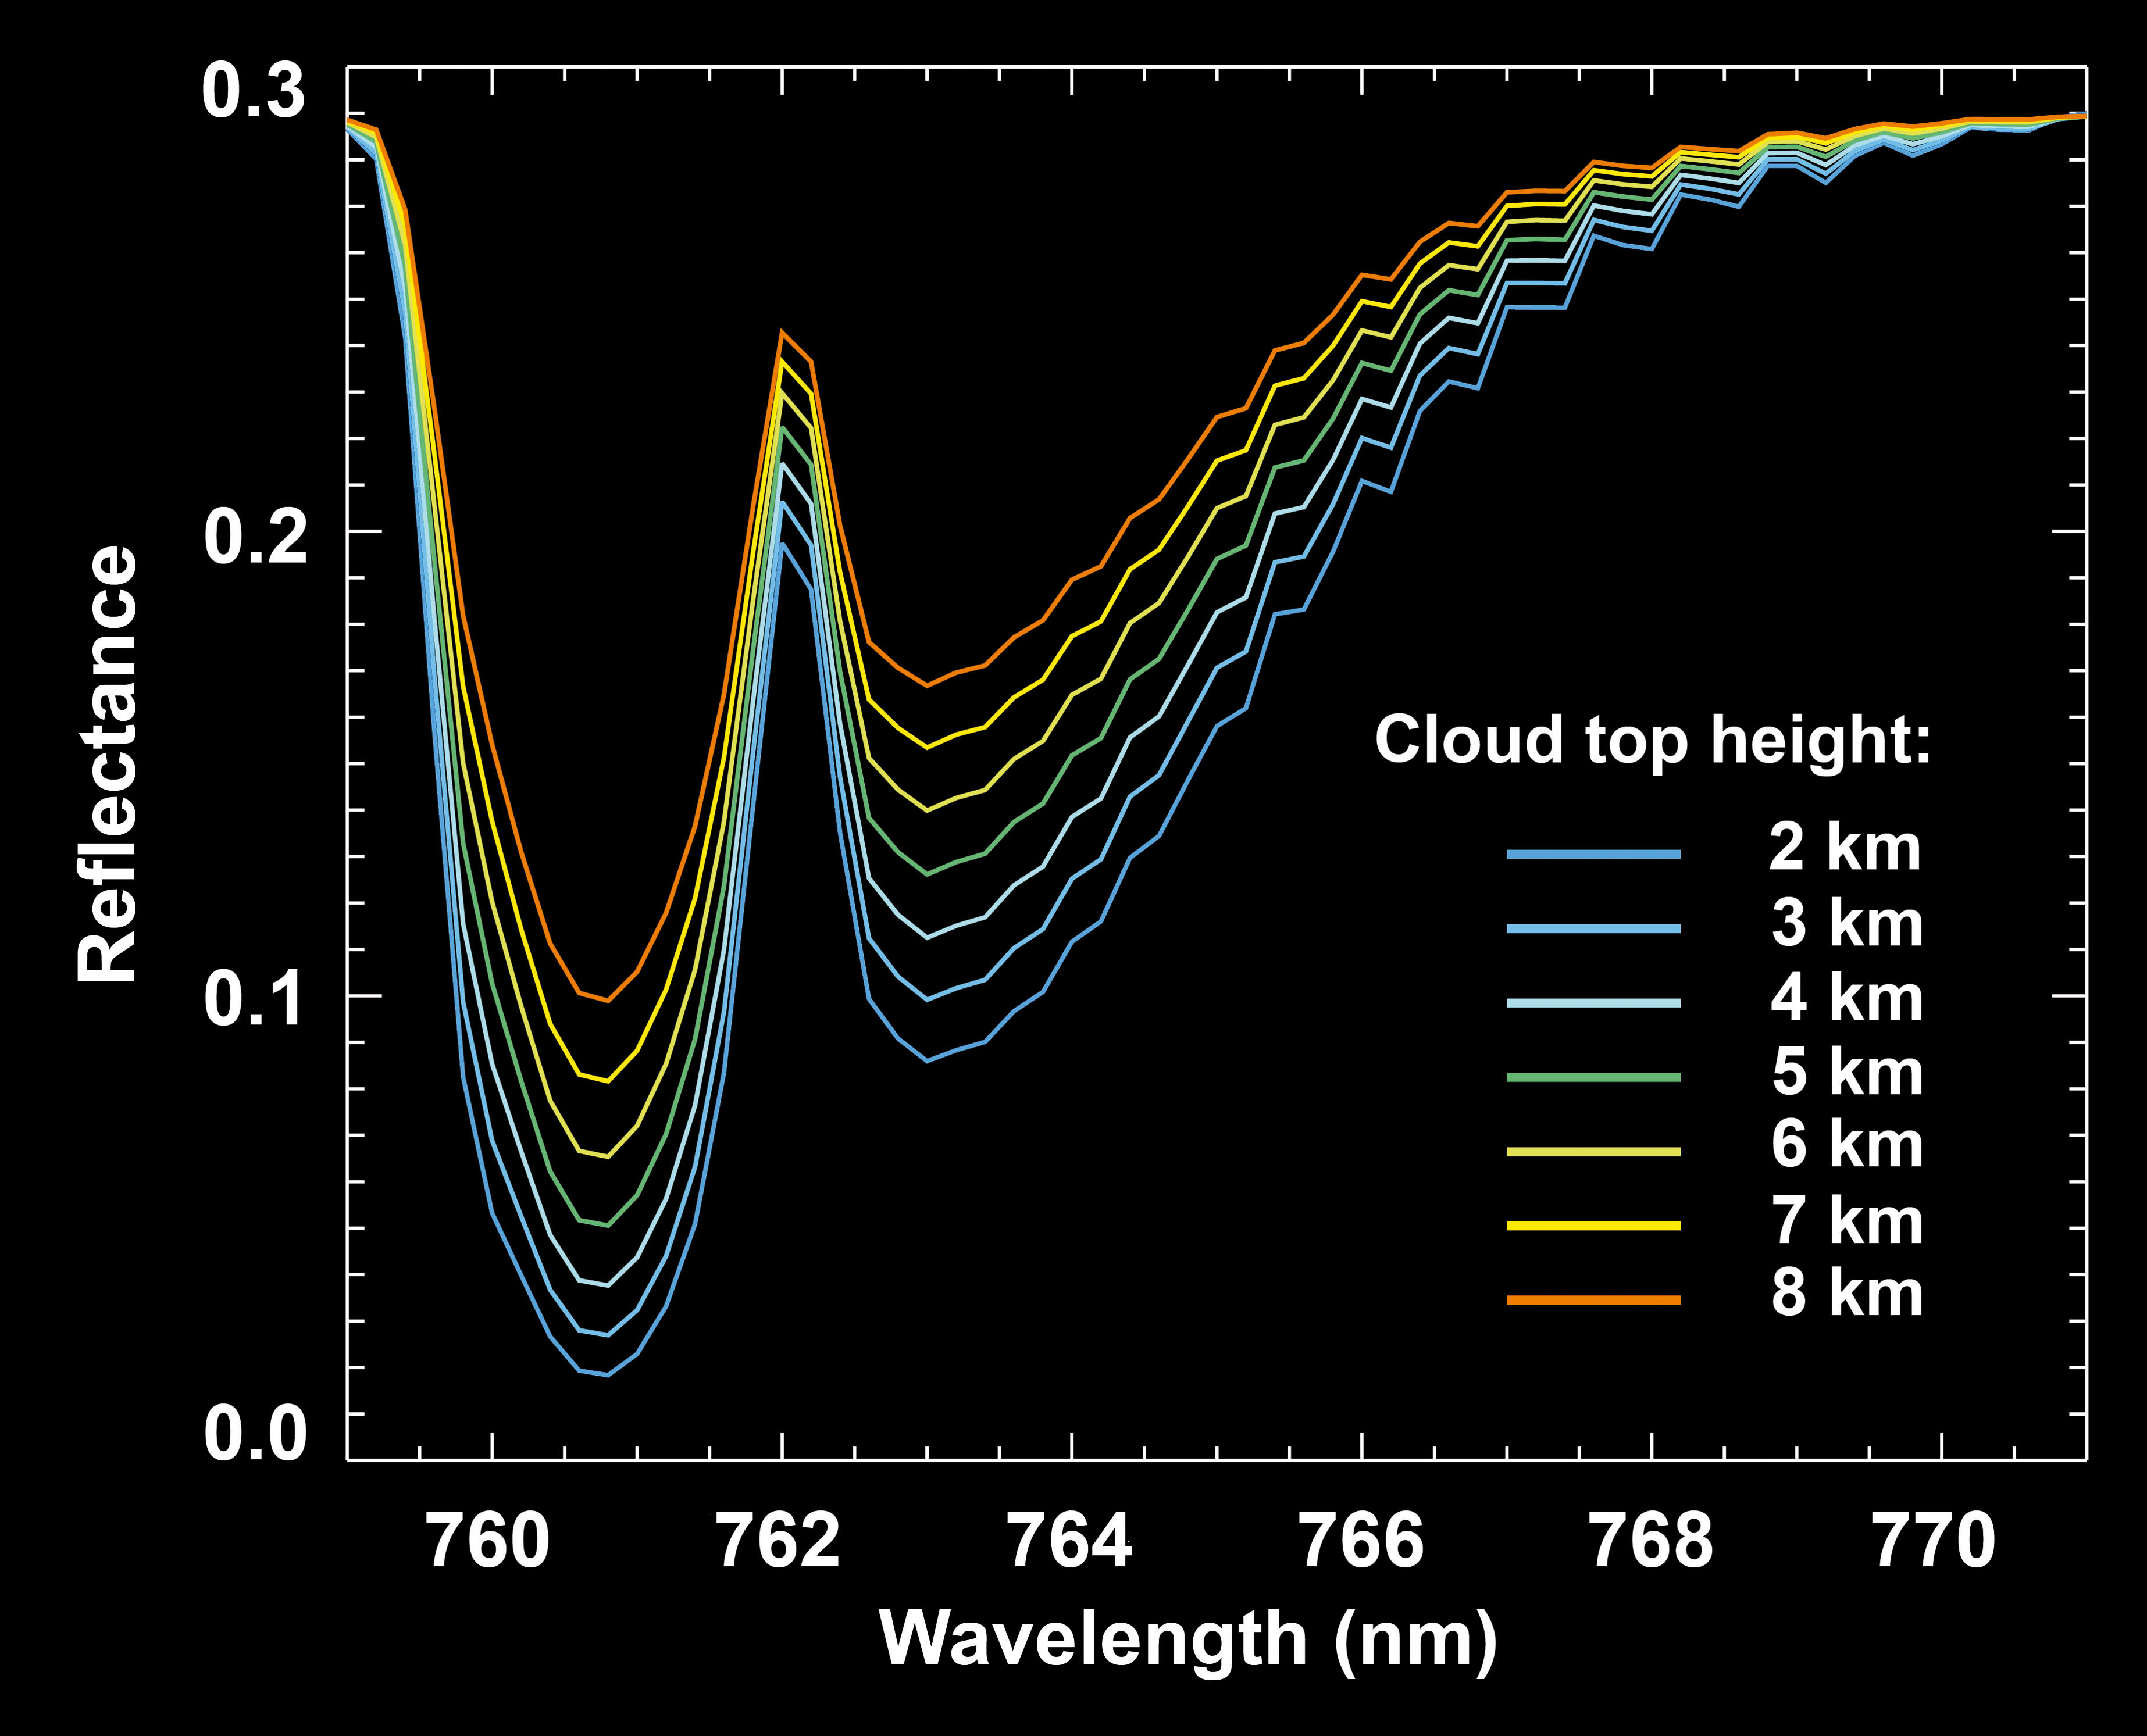
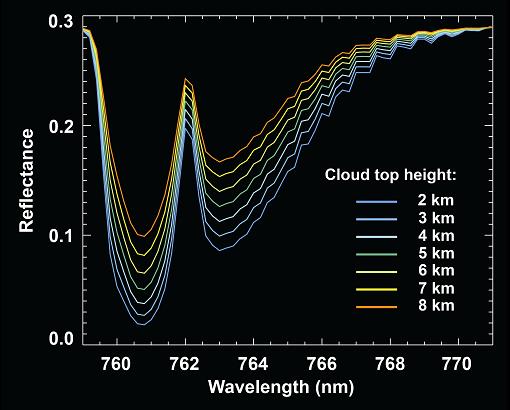
| Fig.
7-9 |
The TOA reflectance in the O2 A-band as a function of cloud top height. (Courtesy: IUP-IFE, University of Bremen)
|
 |
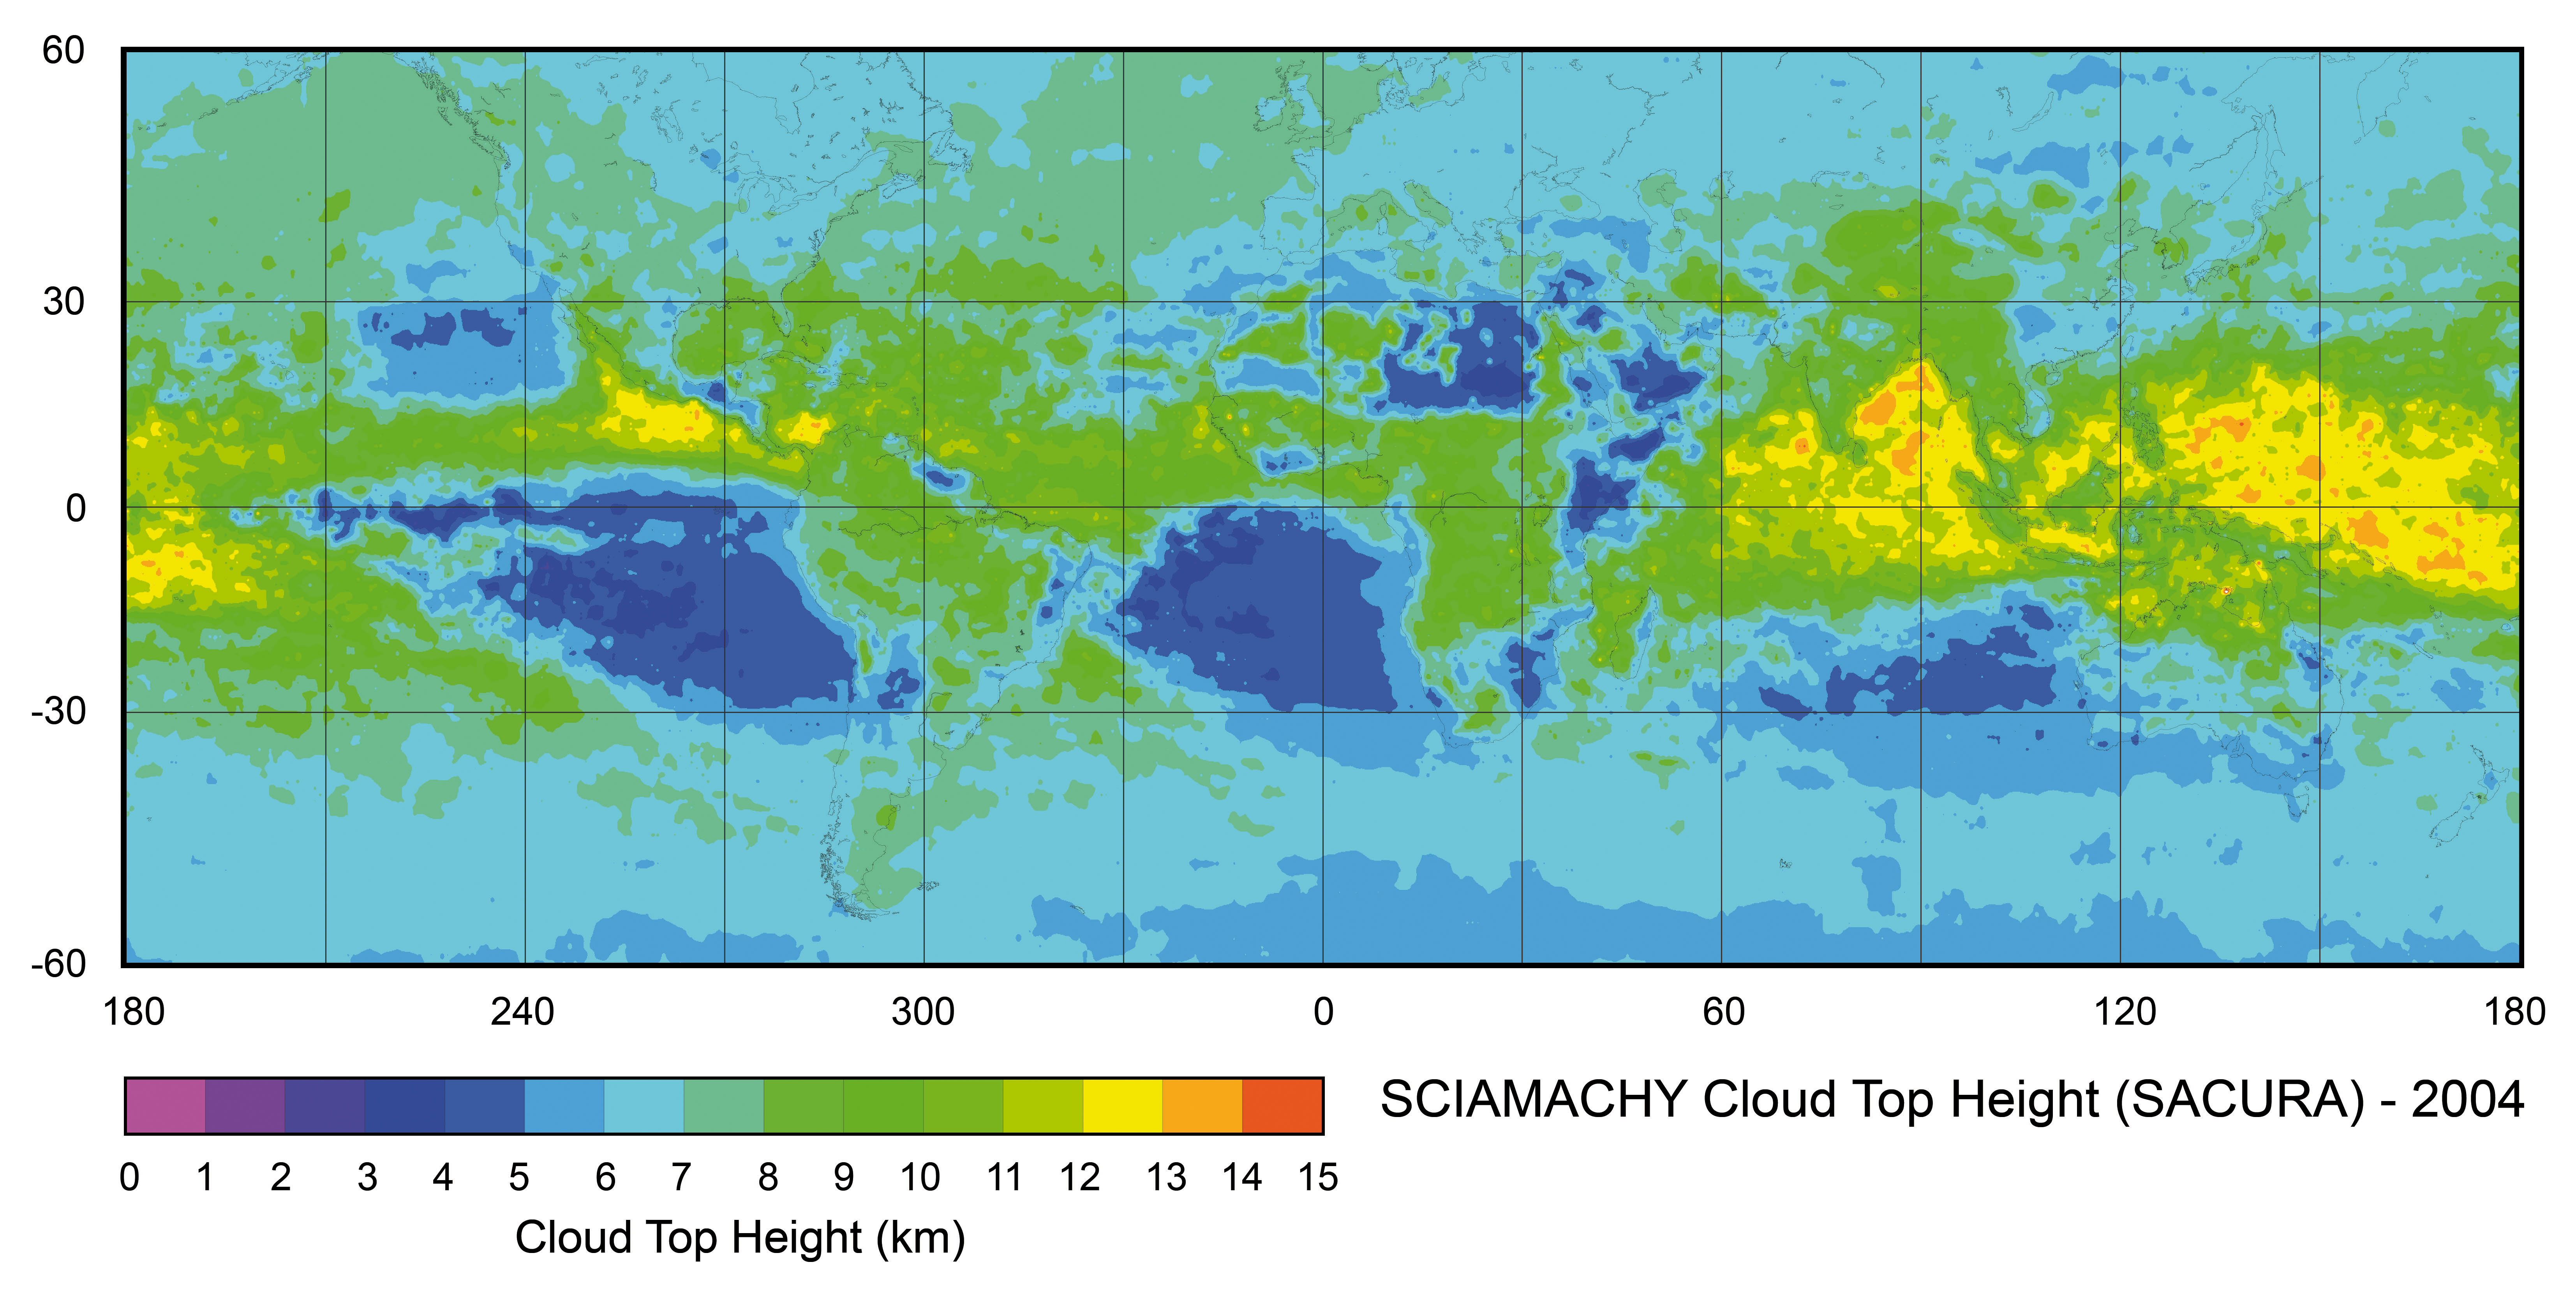
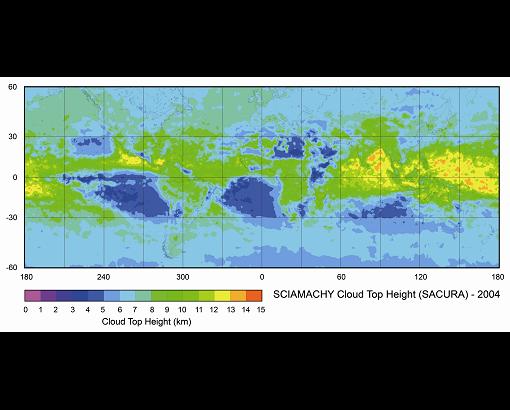
| Fig.
7-10 |
The global distribution of cloud top height as derived with SACURA for 2004.
(Courtesy: IUP-IFE, University of Bremen)
|
 |
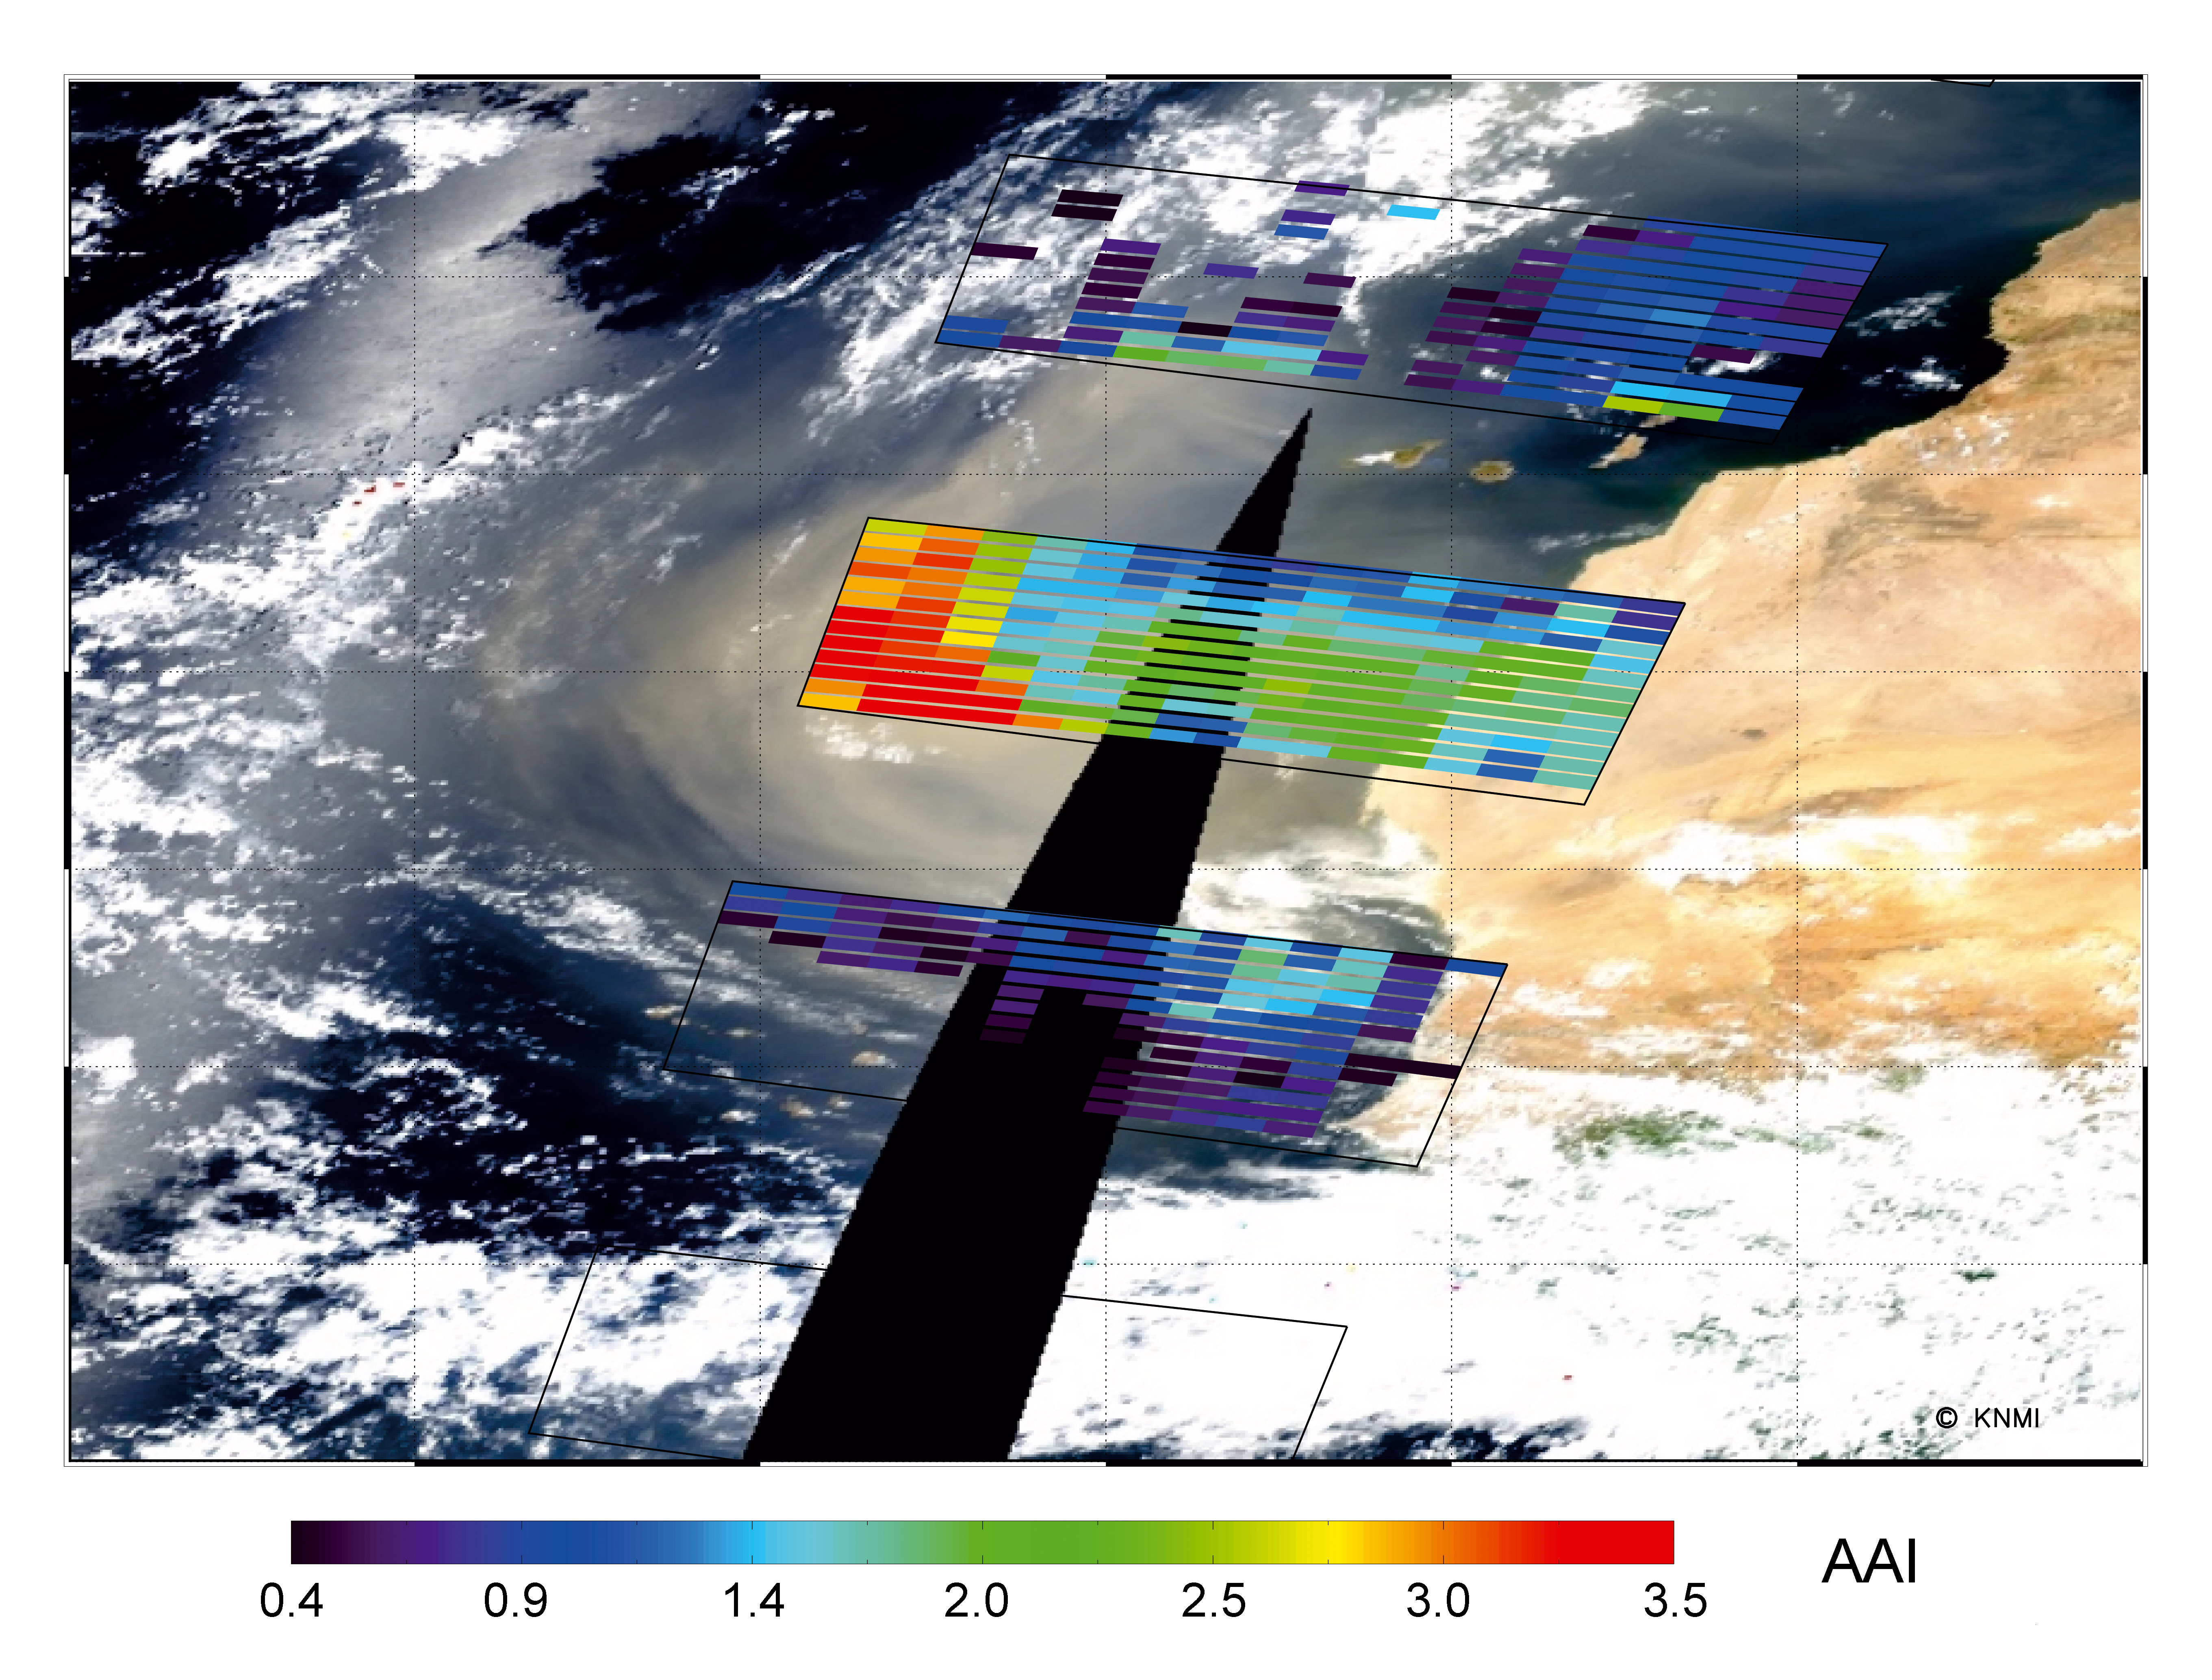
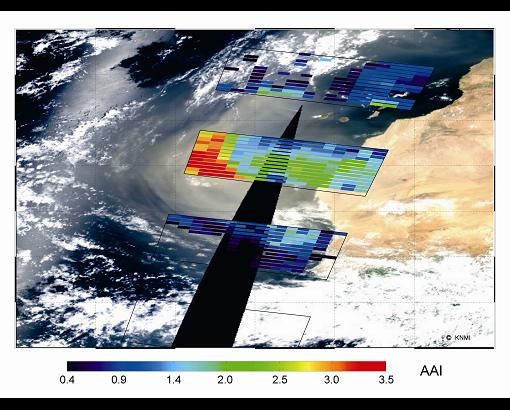
| Fig.
7-11 |
Saharan desert dust outbreak to the Atlantic on 25 July 2004. Shown is the SCIAMACHY AAI at 9:15 UTC
of that day overlaid on a MODIS RGB picture, acquired around 11:10 UTC (right side of the plot) and 12:50 UTC
(left side of the plot). High SCIAMACHY AAI values coincide with the dust plume, visible as a yellow haze on the MODIS image.
(Courtesy: de Graaf et al. 2007)
|
 |
| Fig.
7-12 |
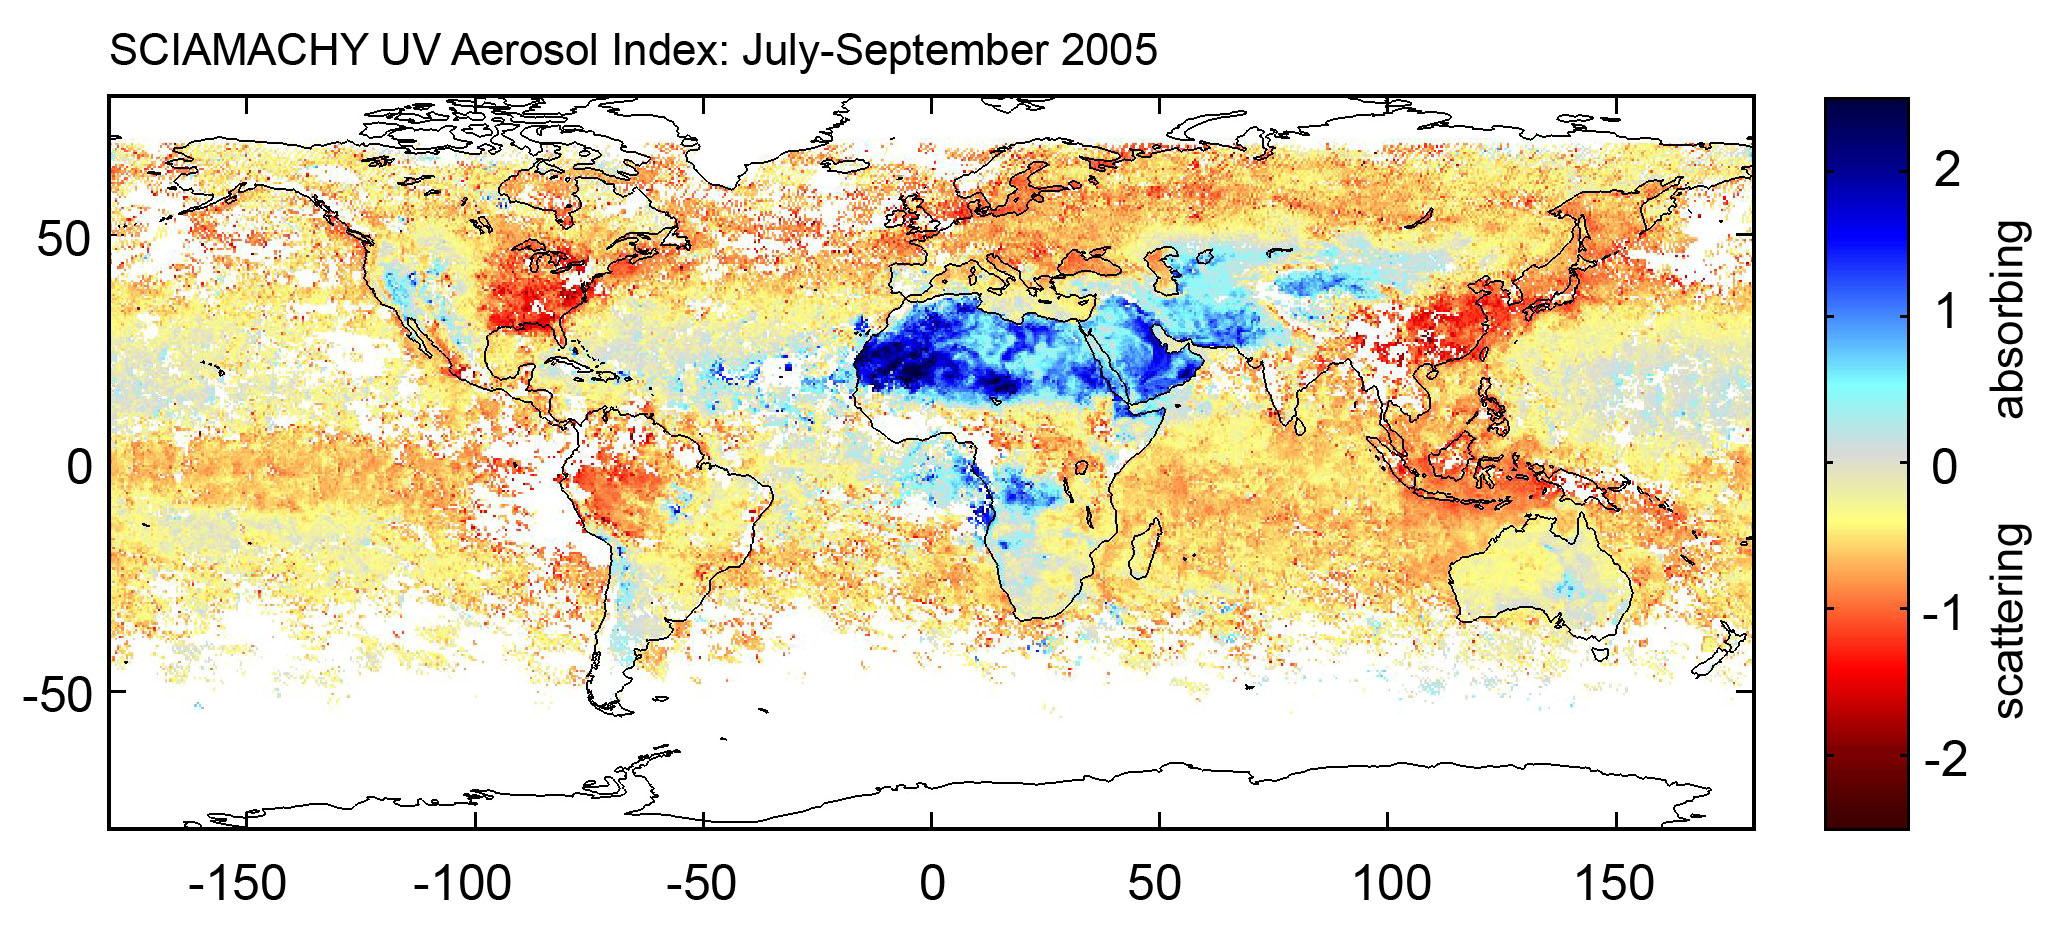
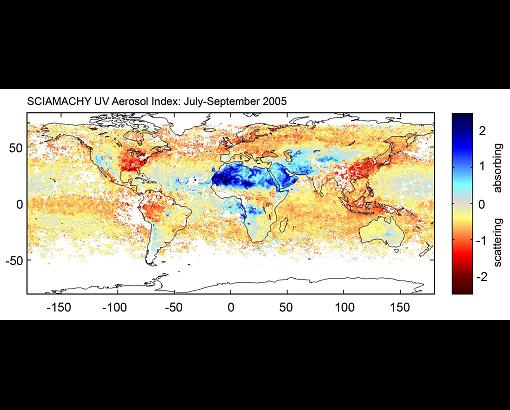
Seasonal average of SCIAMACHY UV Aerosol Index for July-September 2005. Blue indicates absorbing aerosols (mineral dust,
biomass burning smoke); red/orange indicate weakly absorbing but scattering aerosols (sulphate and secondary organic aerosols)
and remaining clouds. Only pixels with cloud fraction smaller than 5% are included in the average. (Courtesy : M. Penning de Vries,
MPI for Chemistry, Mainz)
|
|
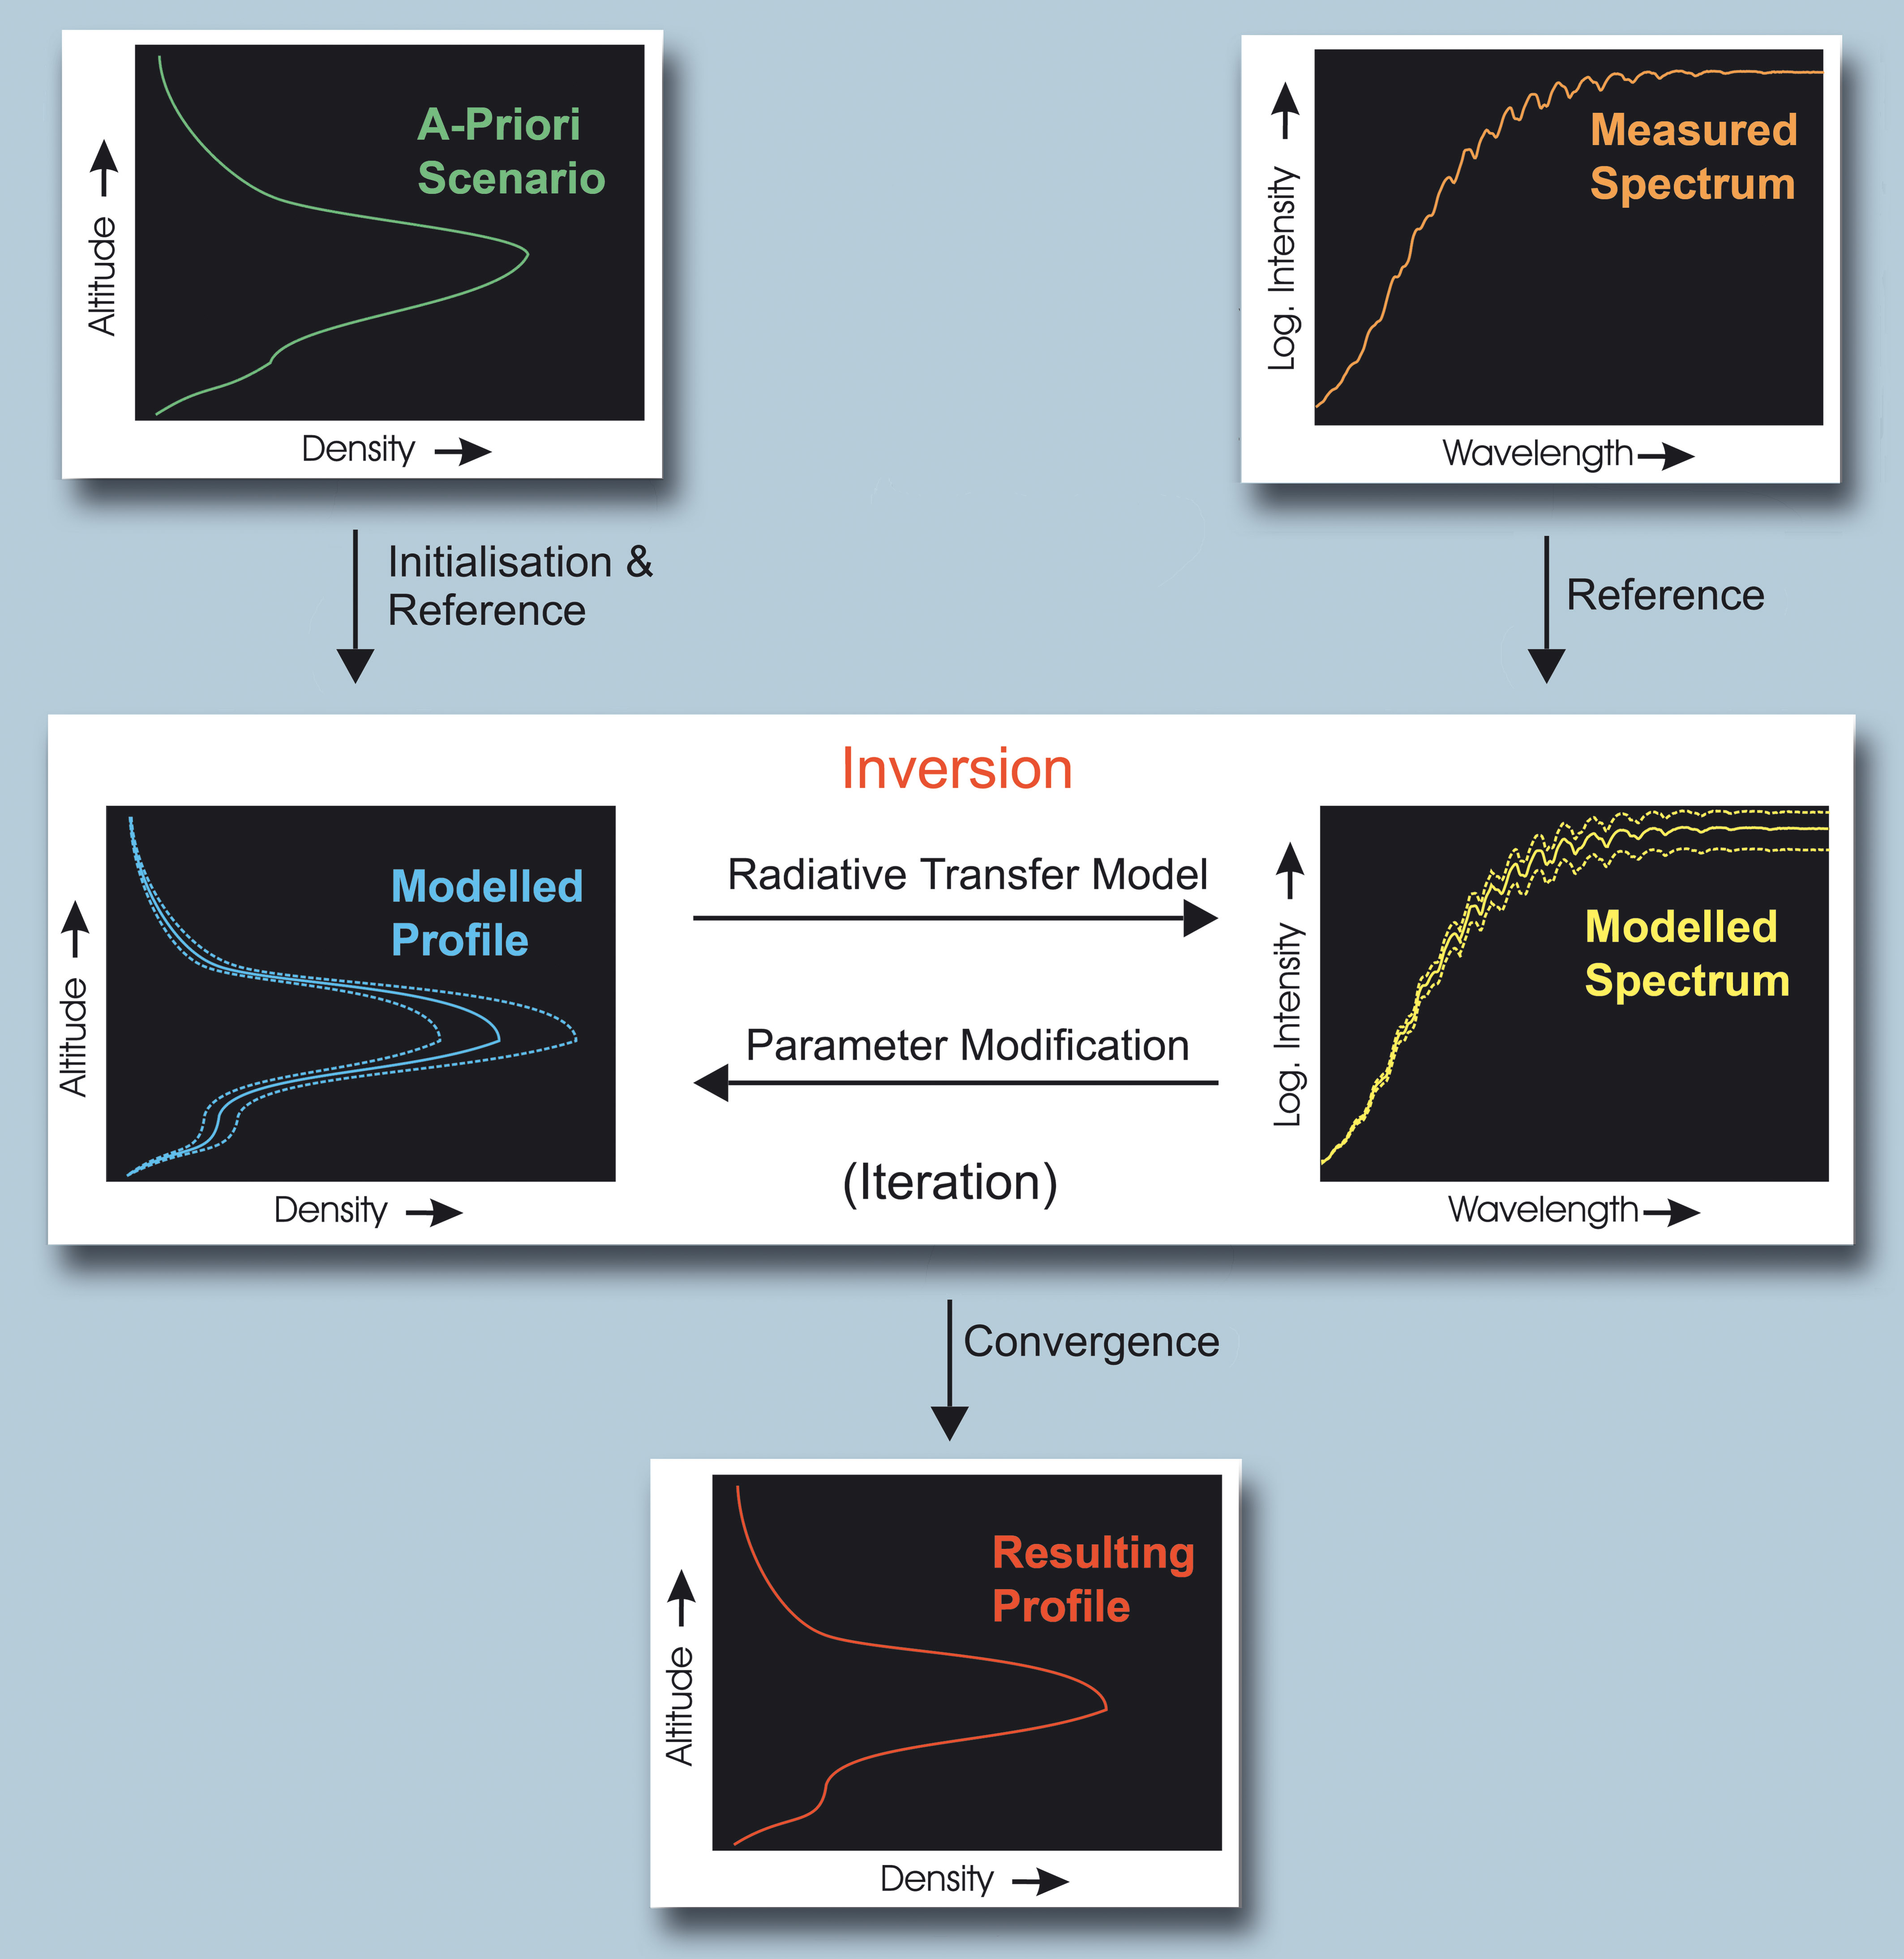
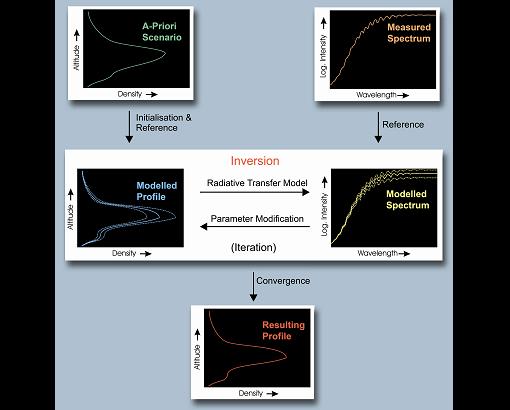
| Fig.
7-13 |
The principle of inversion for the retrieval of geophysical parameters. For further details see the text.
(Courtesy: IUP-IFE, University of Bremen)
|
|
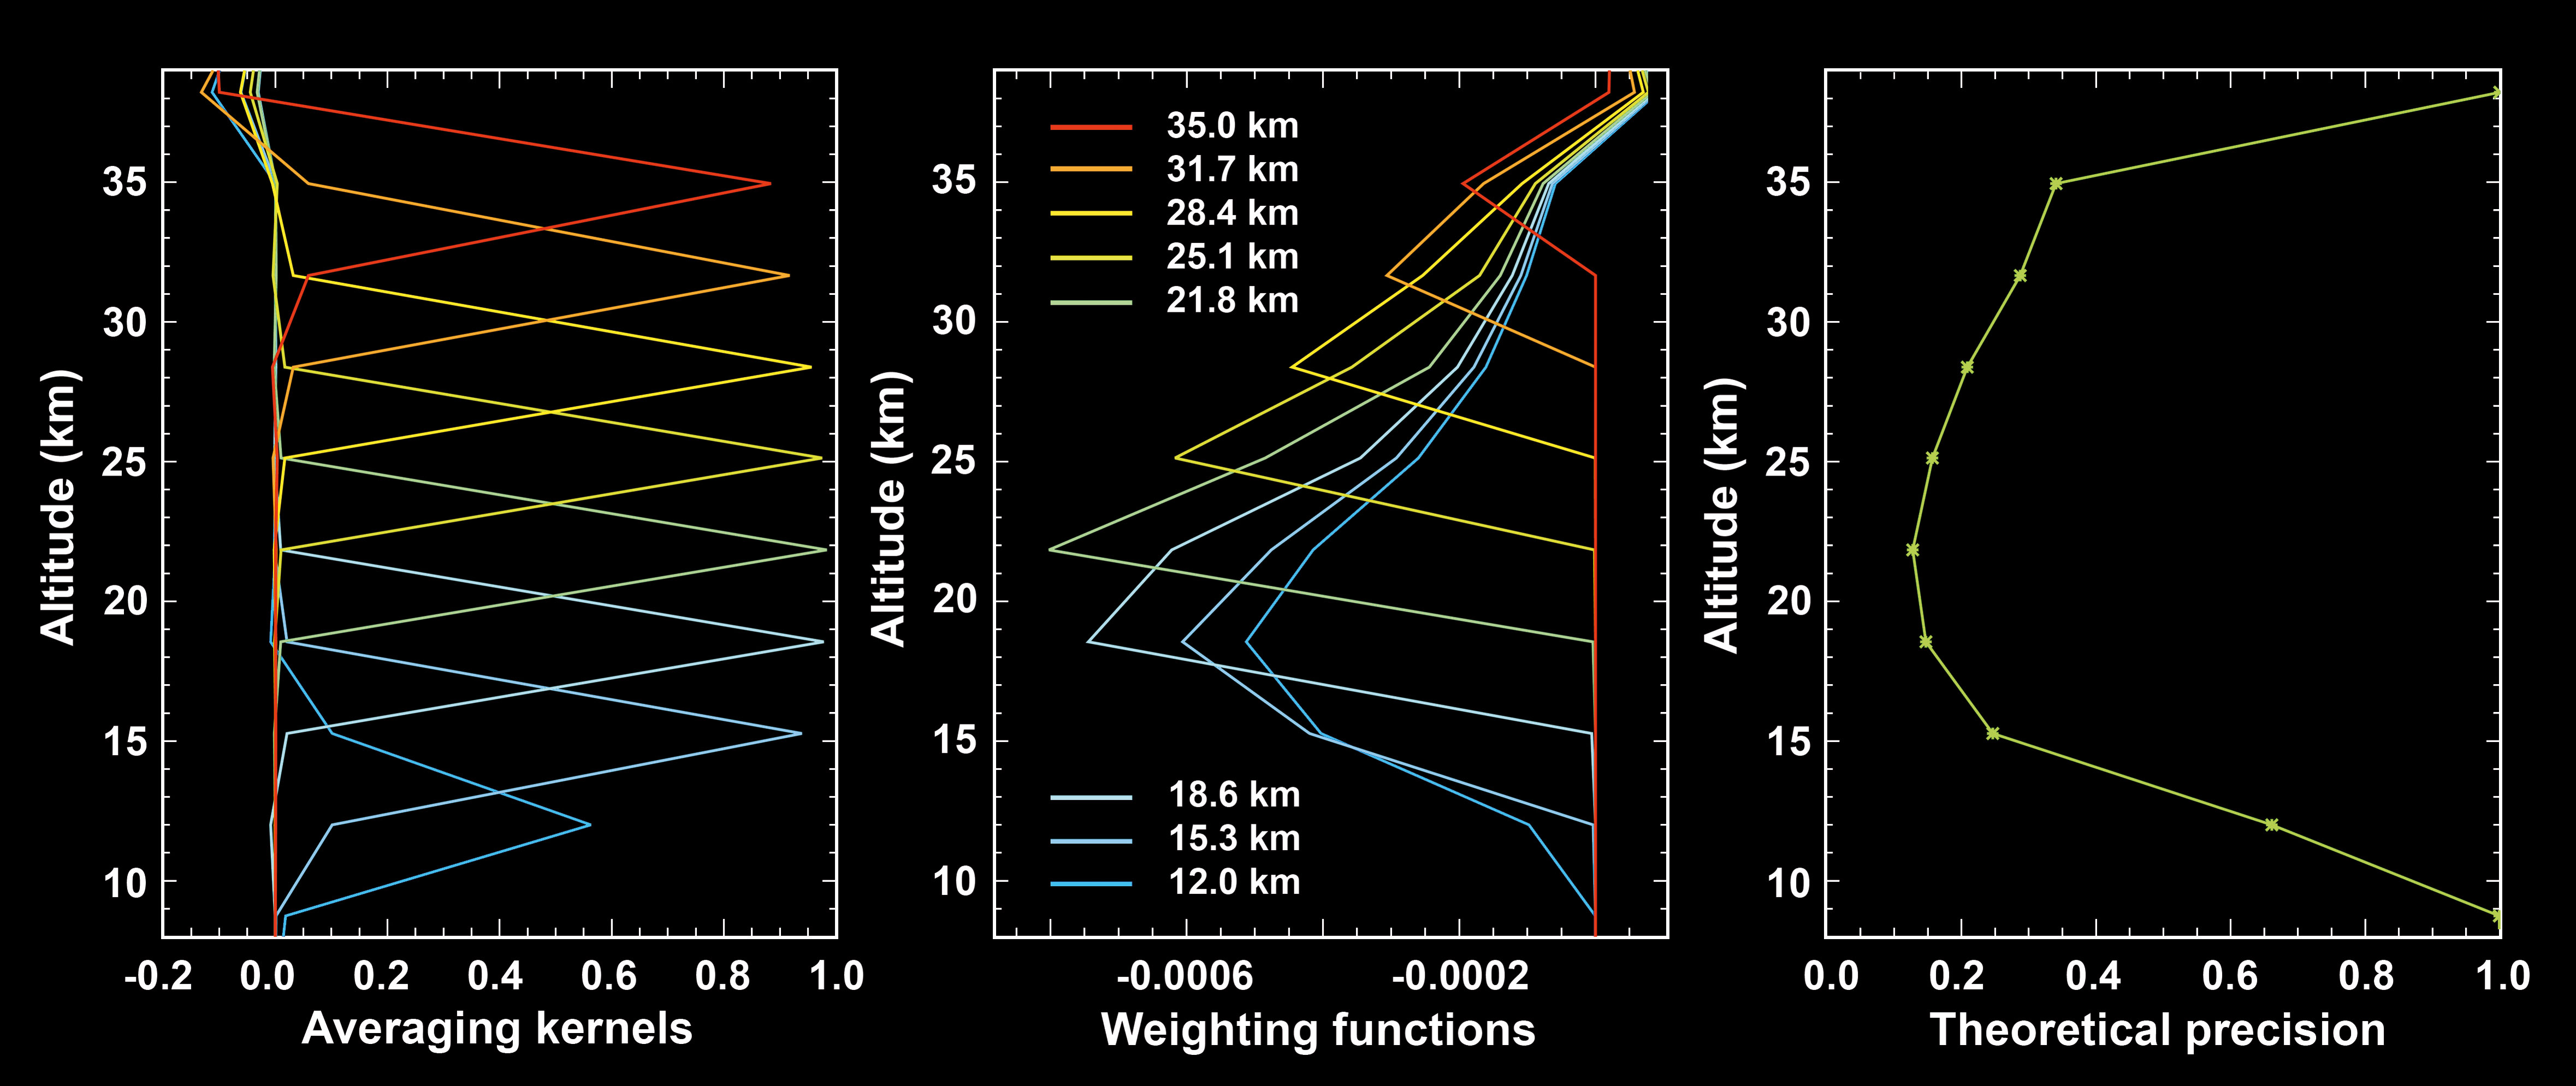
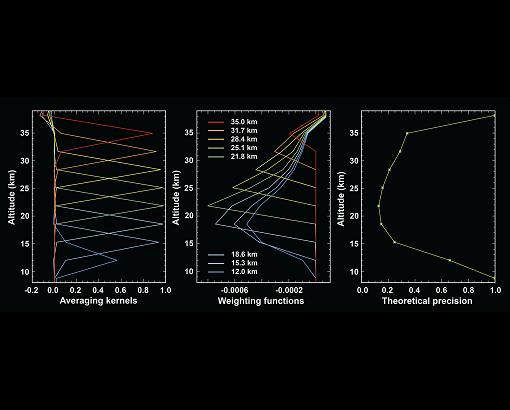
| Fig.
7-14 |
Averaging kernels (left), weighting functions at 338.6 nm (middle), and theoretical precision (right) for
BrO vertical profile retrievals from SCIAMACHY limb measurements. (Courtesy: IUP-IFE, University of Bremen)
|
|
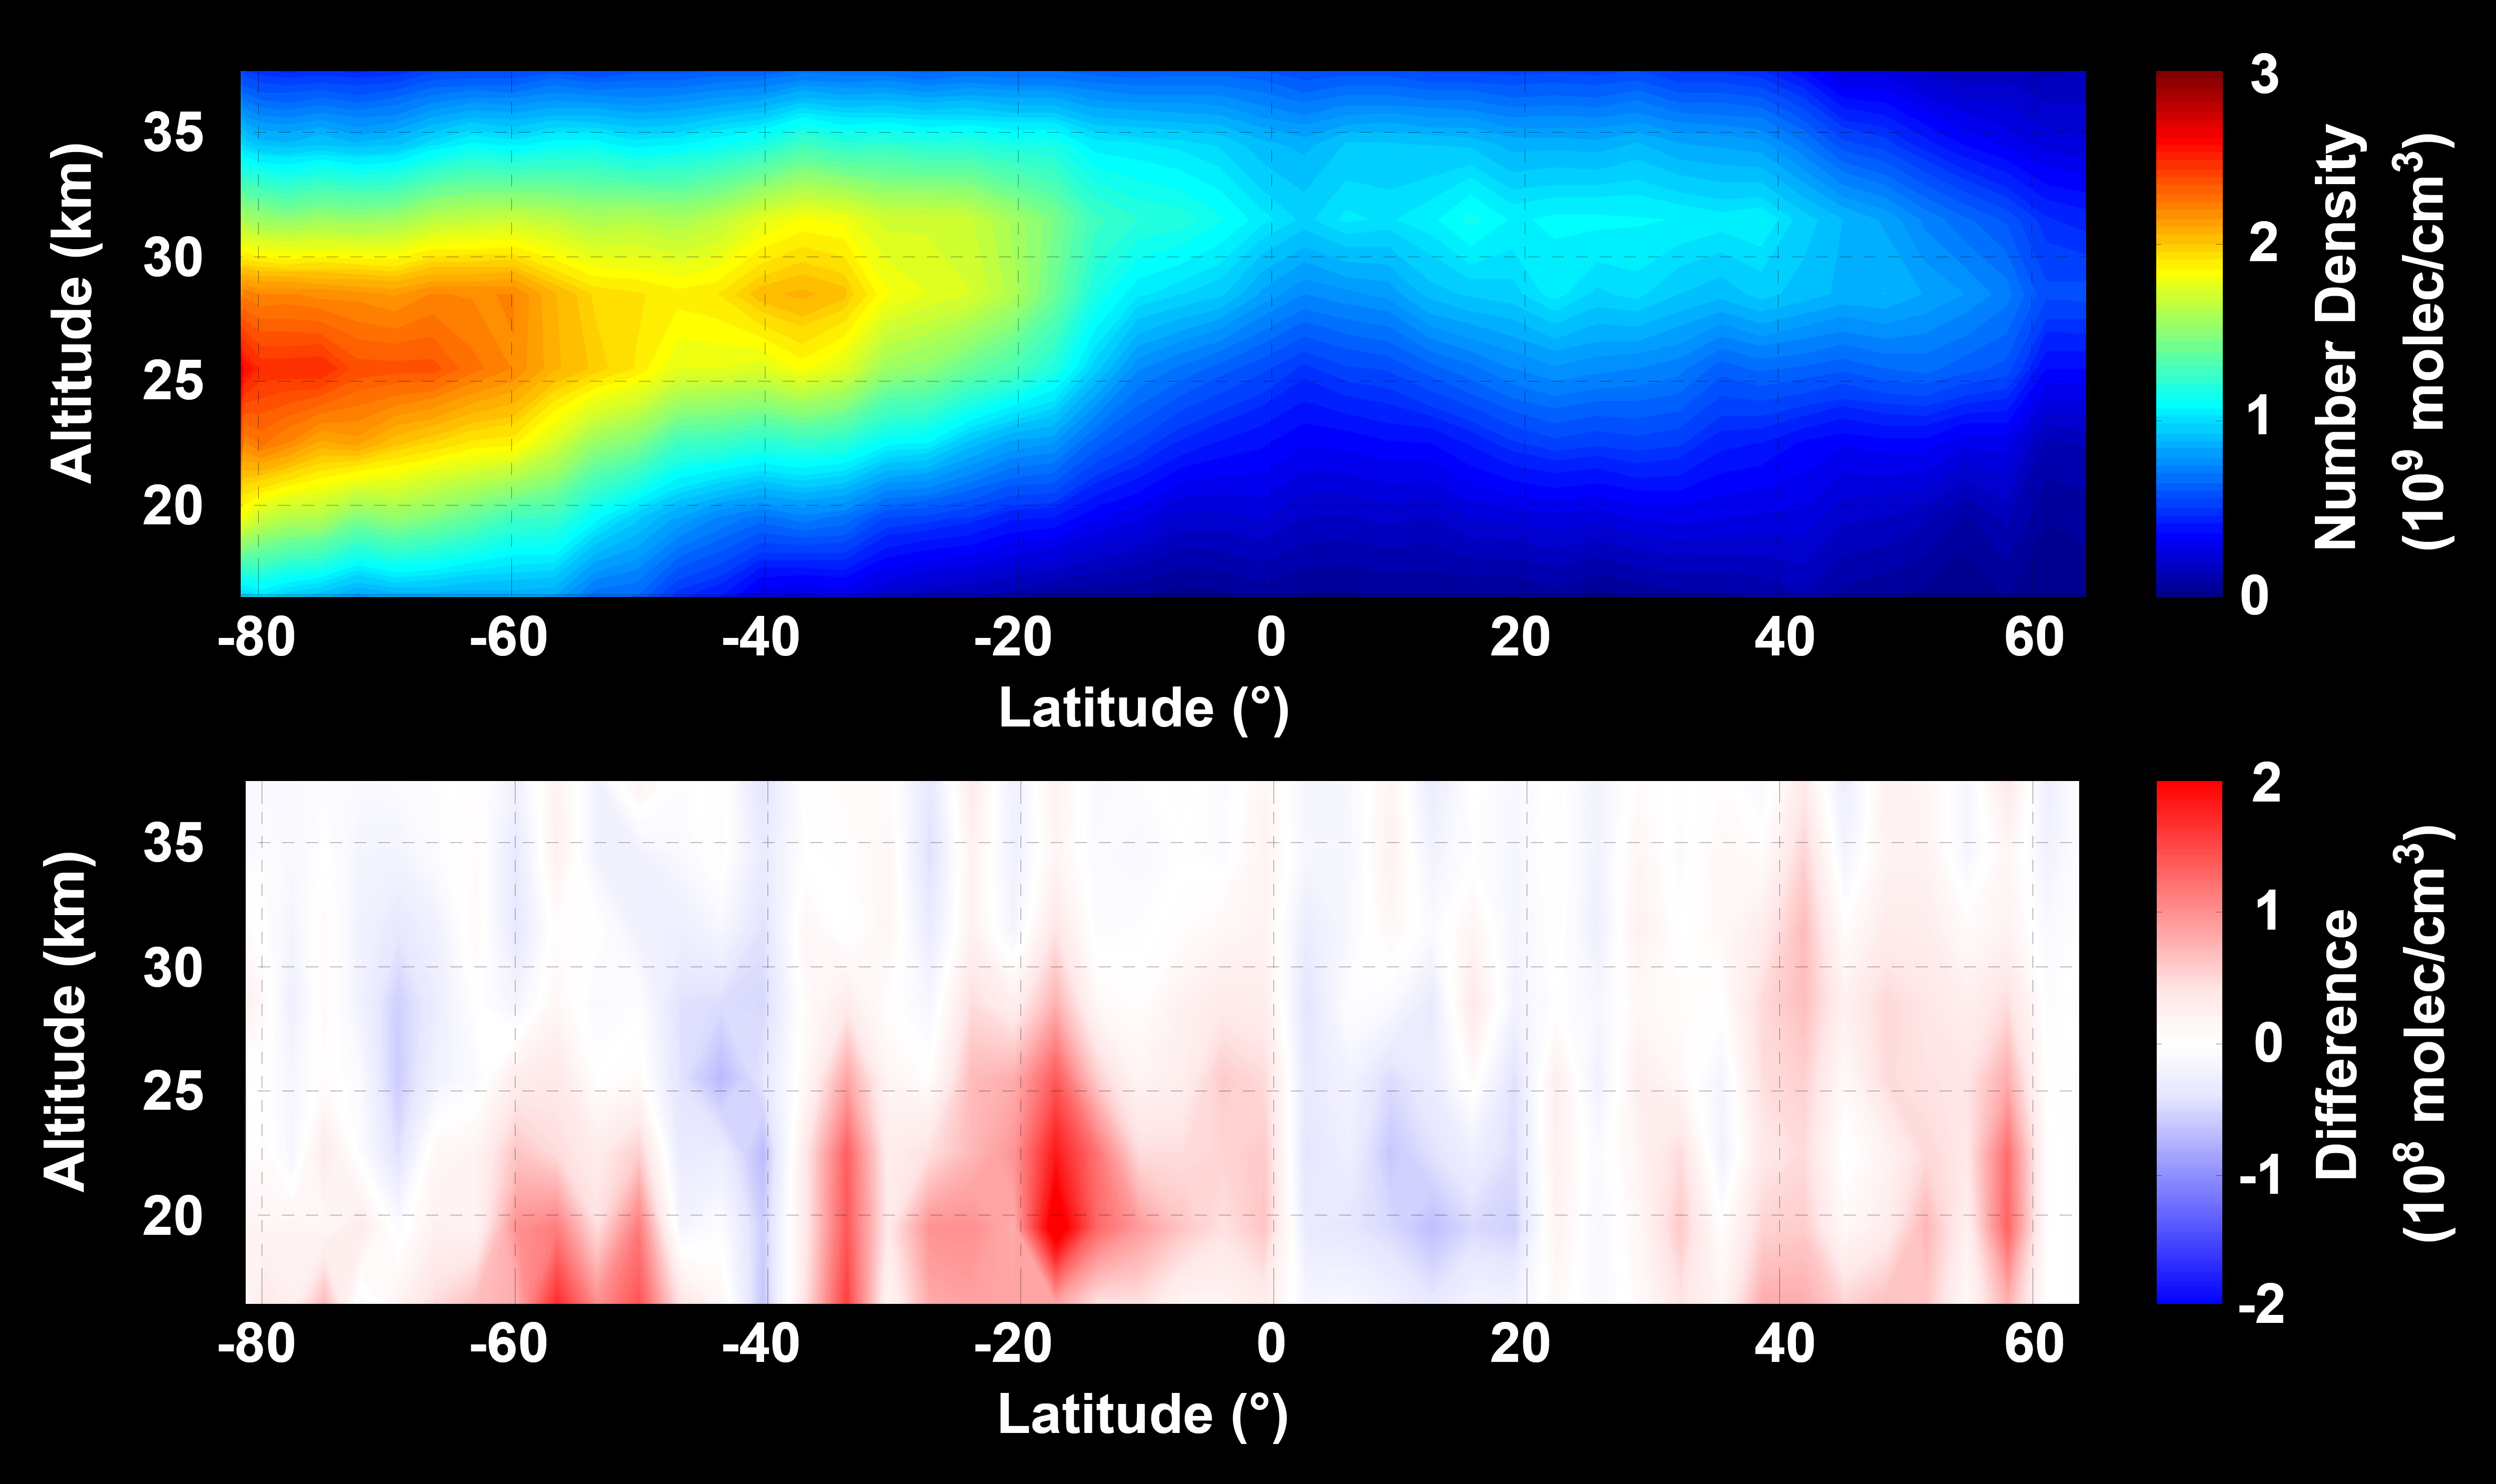
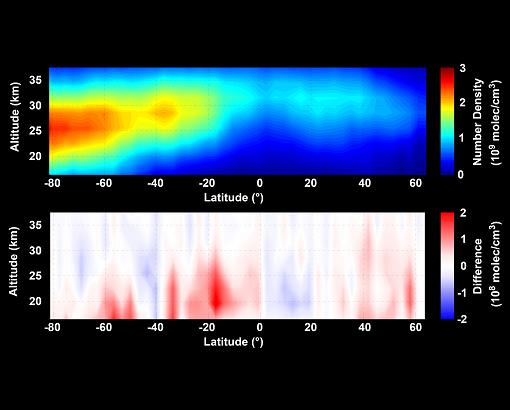
| Fig.
7-15 |
A
NO2 densities (top panel) as derived from SCIAMACHY limb measurements using the limb 2D tomography method for the orbit 35499
(14 December 2008) consisting of limb states only. In the bottom panel, the difference to results from the less accurate 1D
approach is illustrated. (Courtesy: J. Pukite, MPI for Chemistry, Mainz)
|
|
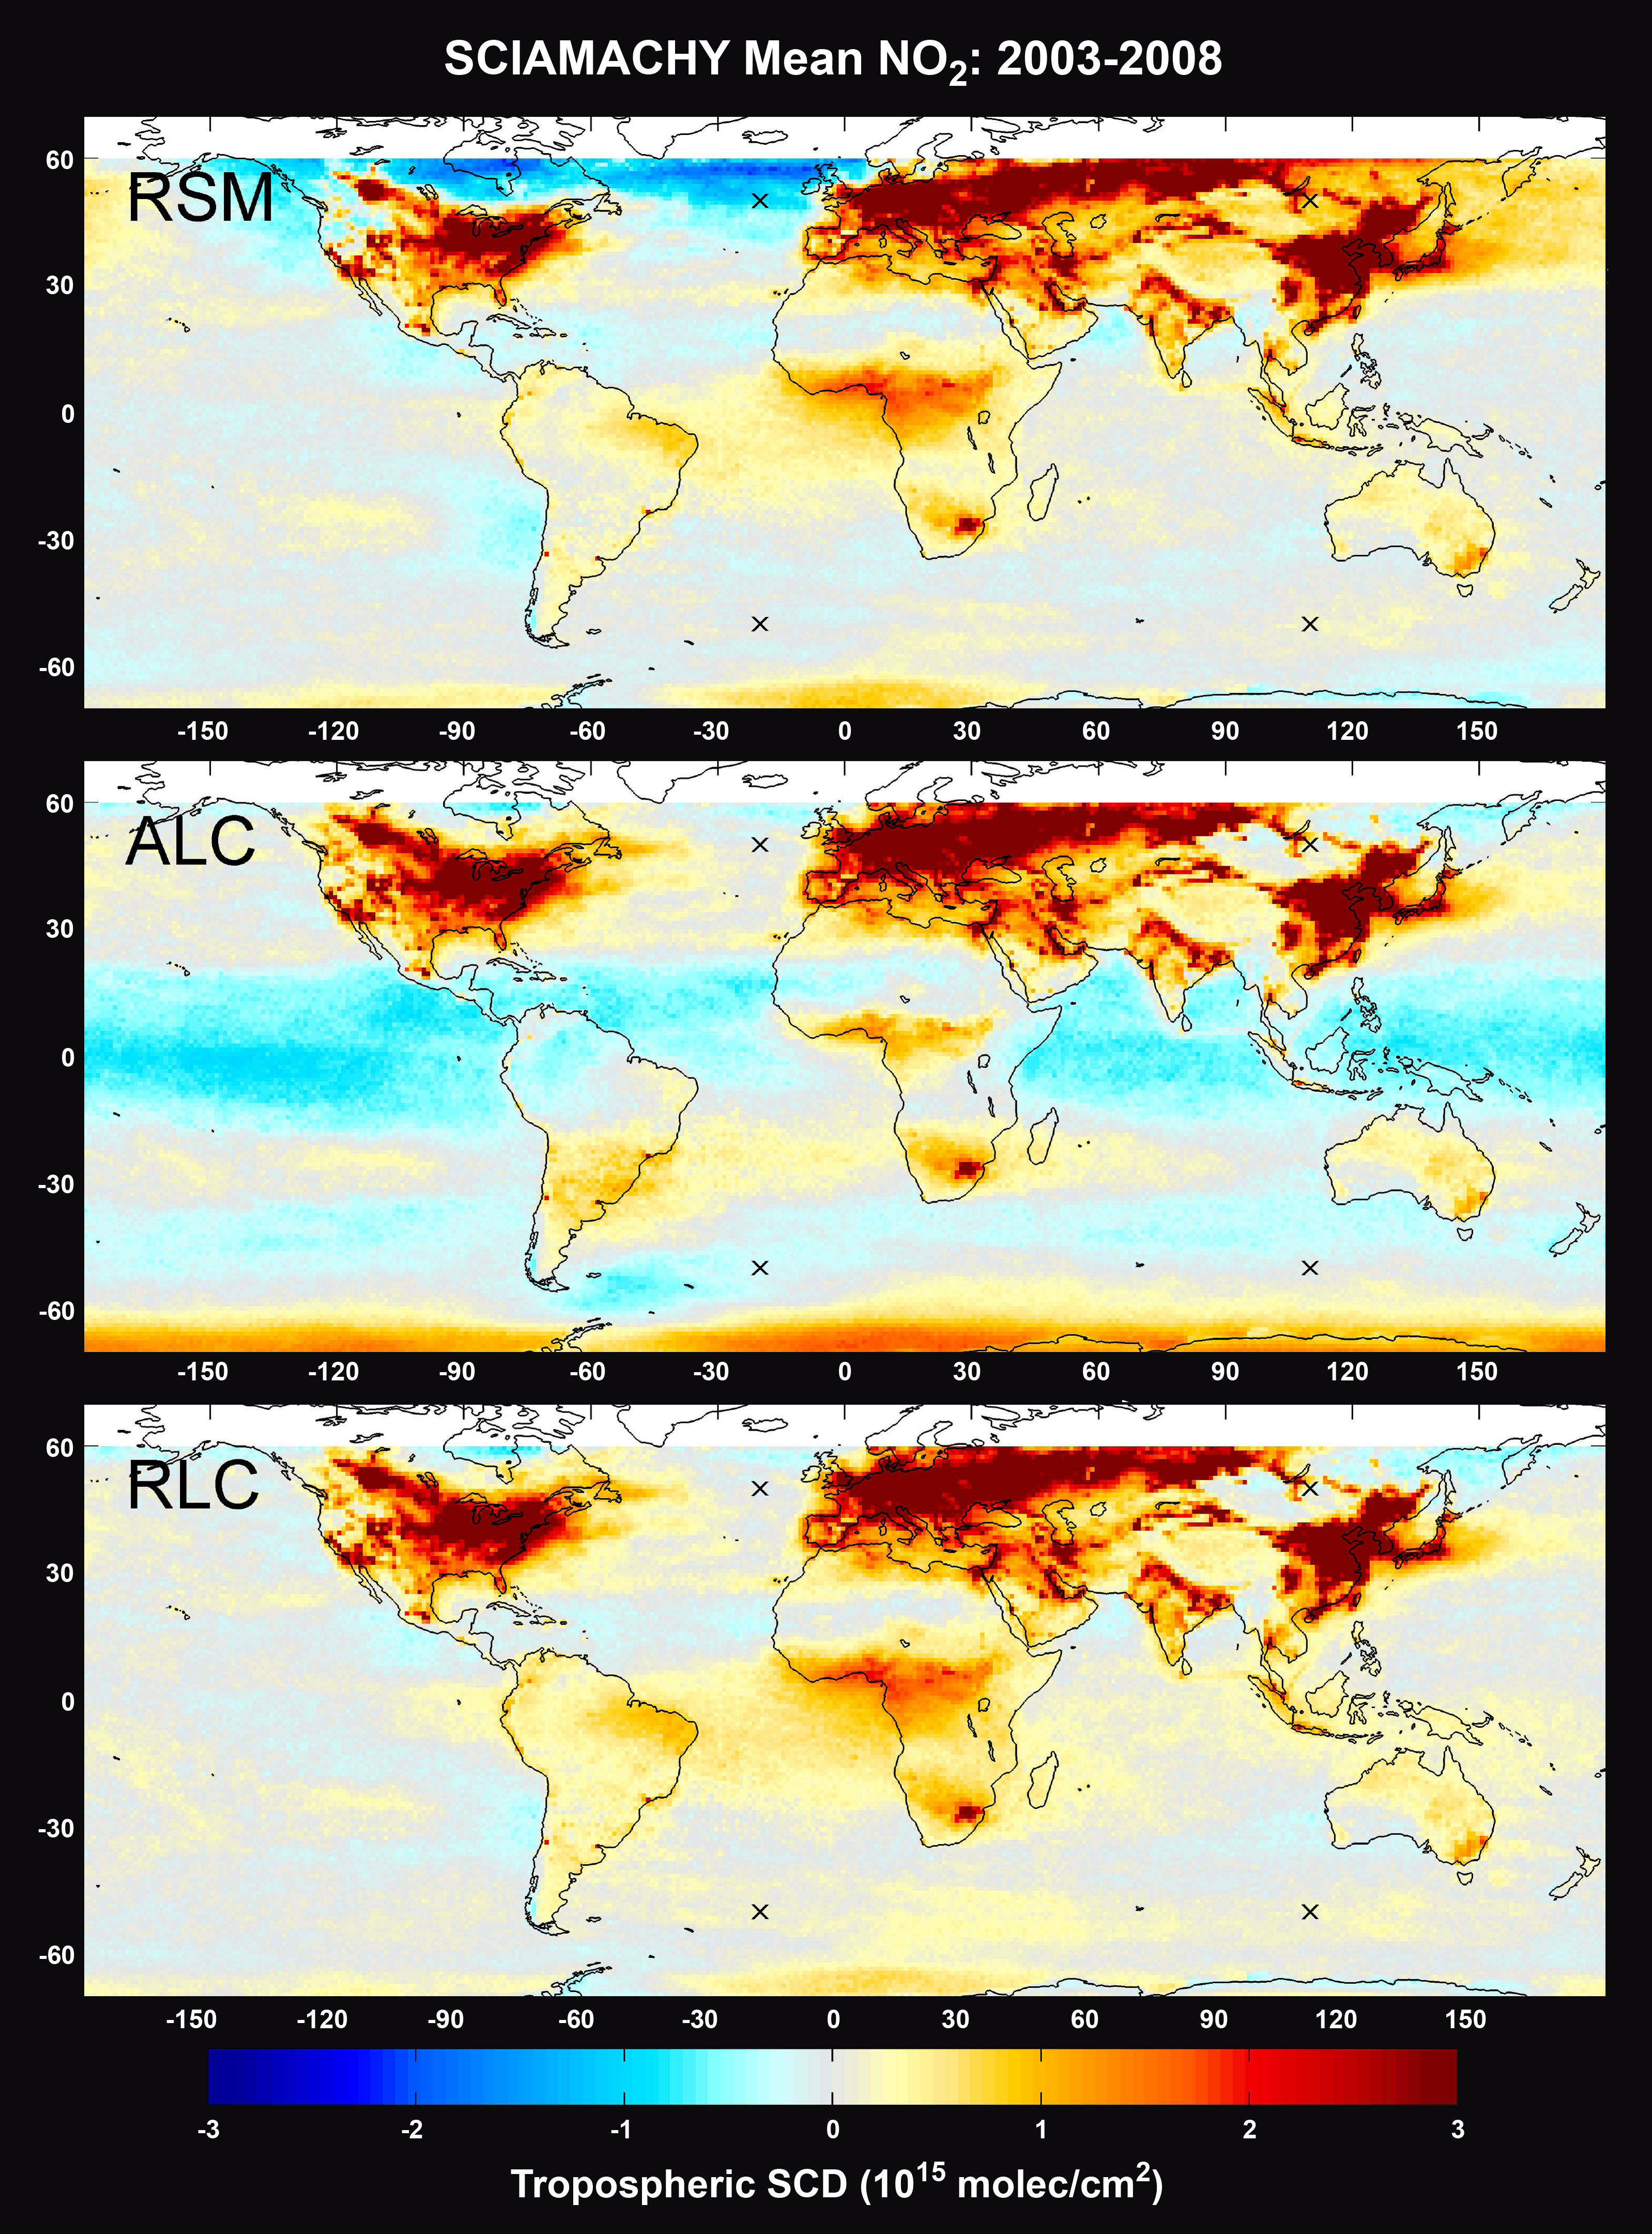
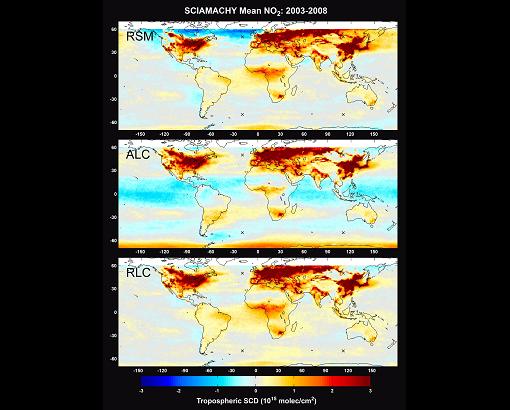
| Fig.
7-16 |
Mean tropospheric NO2 slant column densities as derived for the period
2003-2008 using the Reference Sector Method (RSM - top), Absolute Limb
Correction (ALC - middle) and Relative Limb Correction (RLC - bottom).
Courtesy: S. Beirle, MPI for Chemistry, Mainz)
|
|
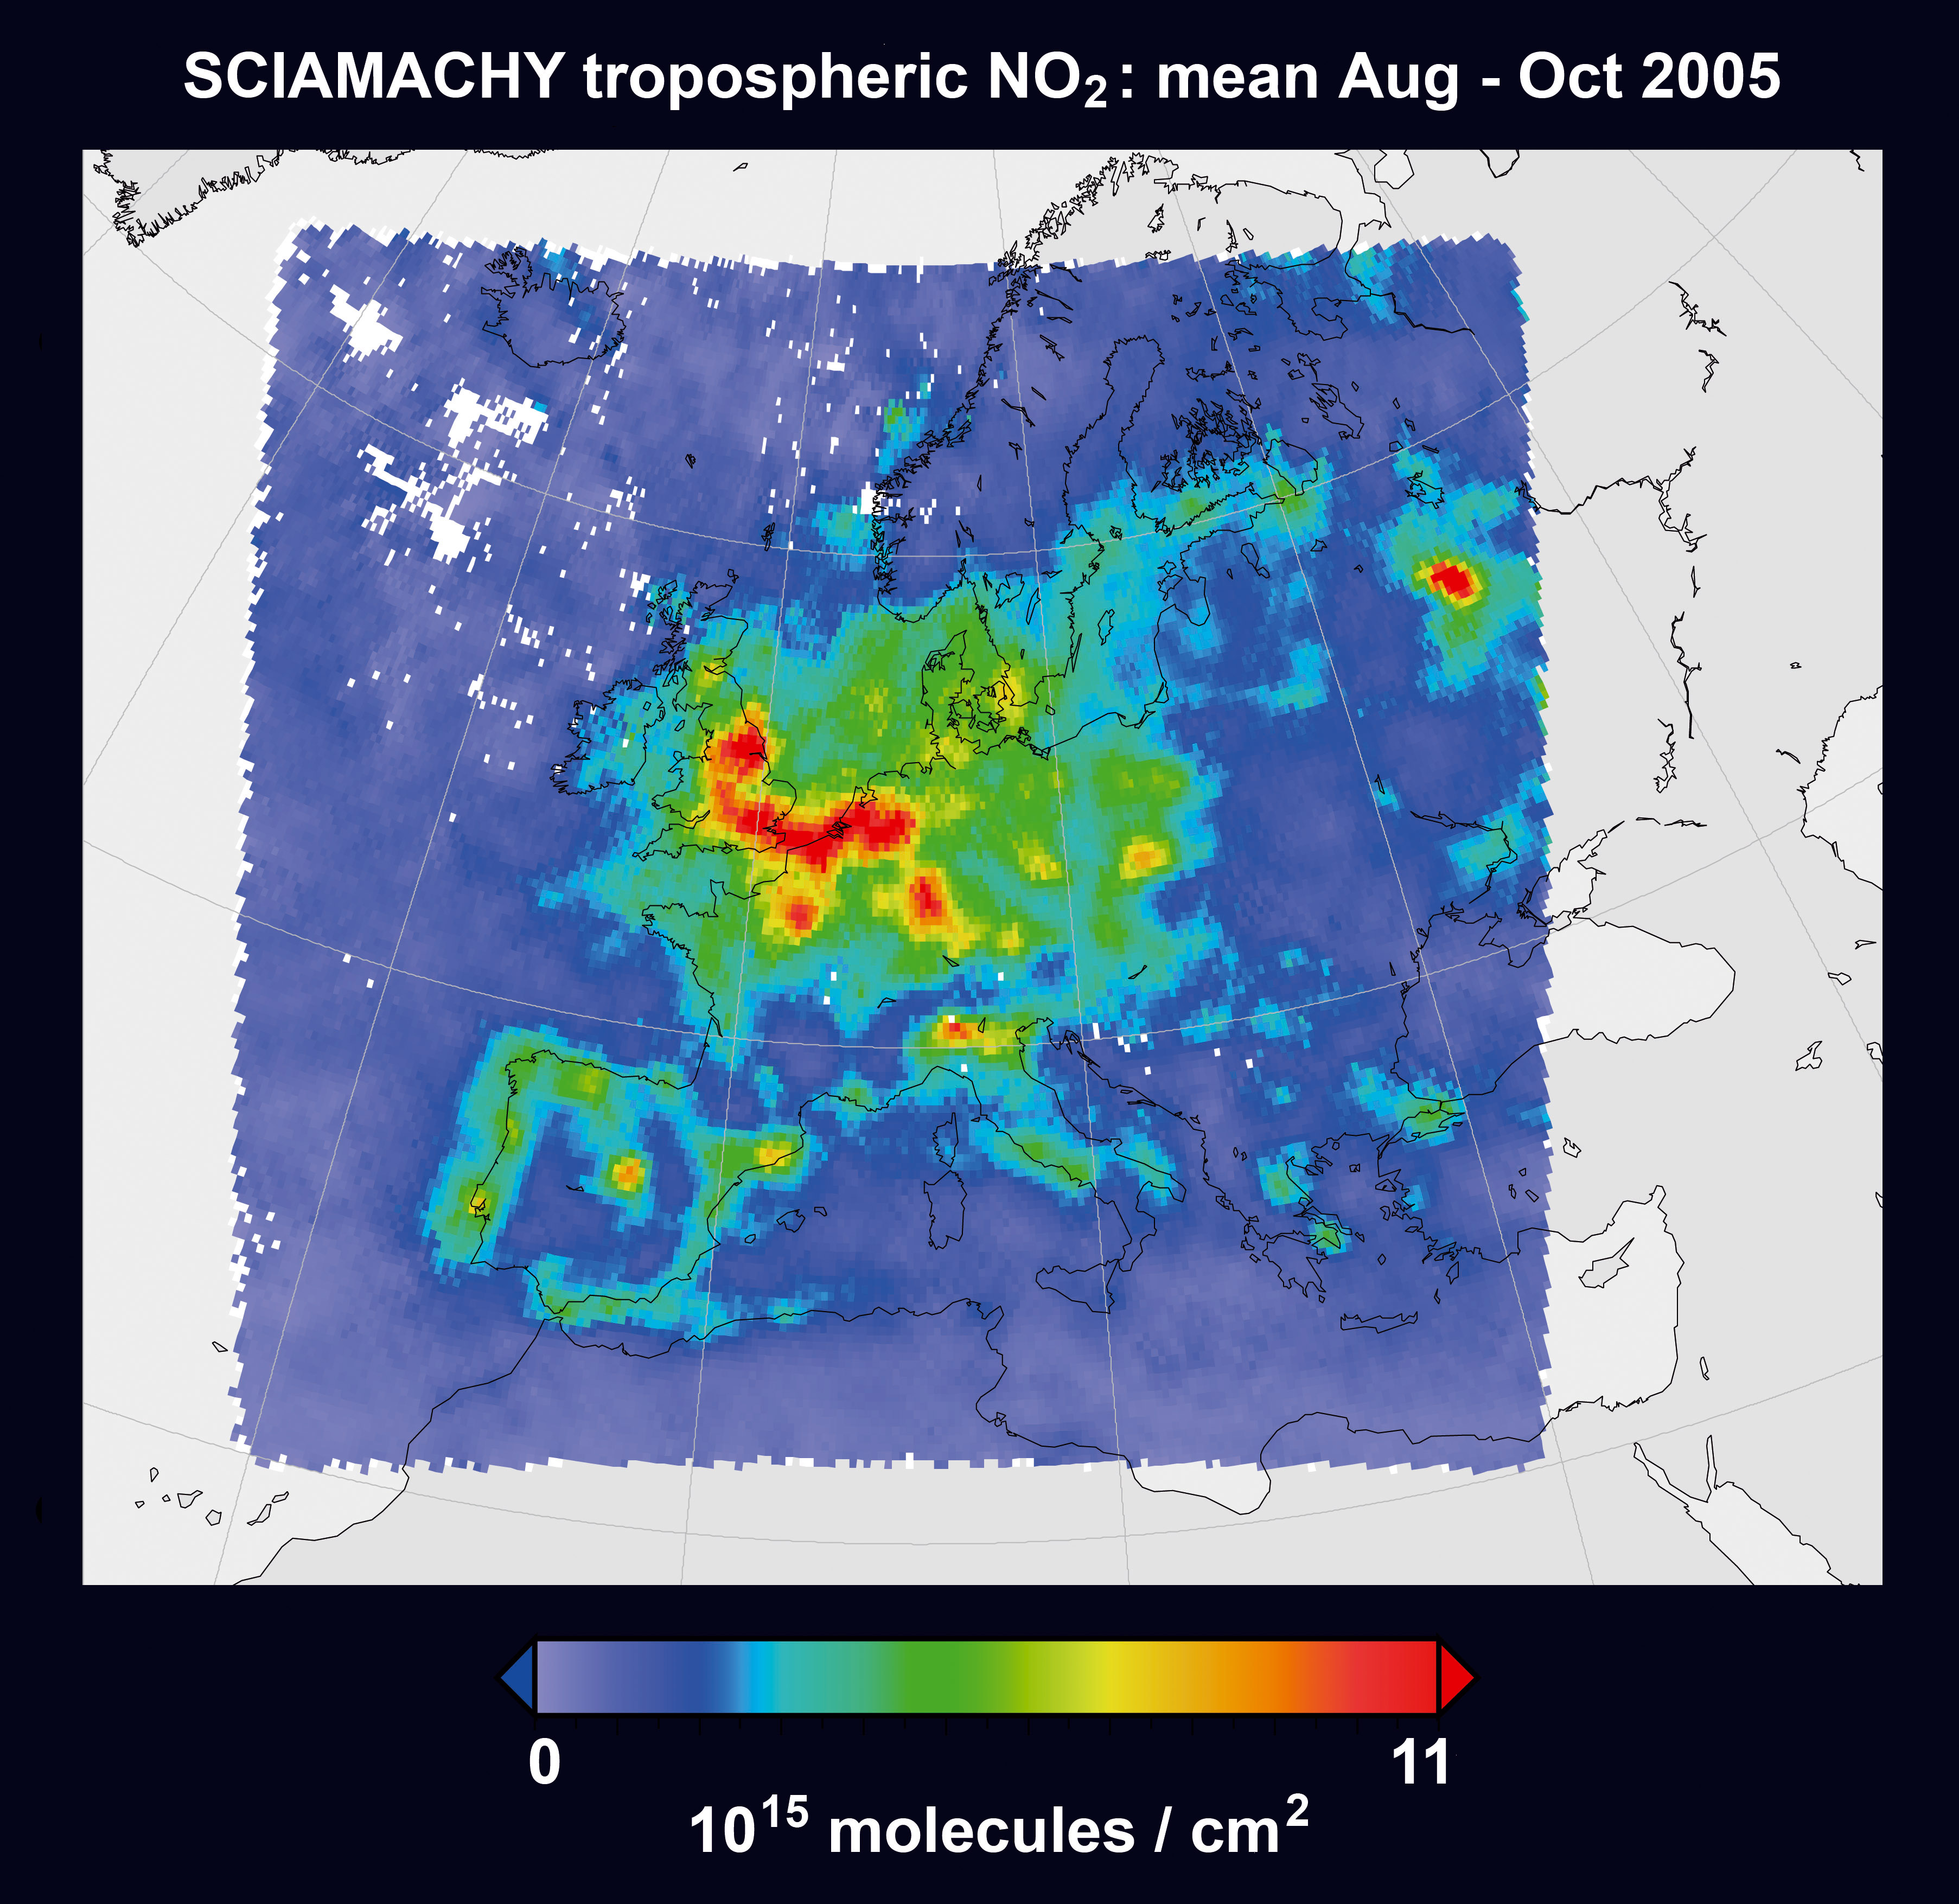
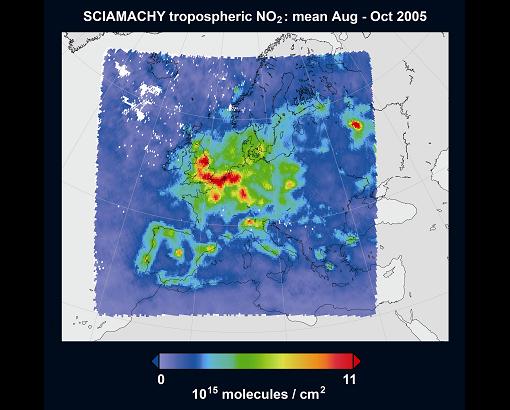
| Fig.
7-17 |
Mean tropospheric NO2 vertical column densities over Europe as derived
from SCIAMACHY for August to October 2005 with the DLR-DFD assimilation
approach. (Courtesy: T. Erbertseder, DLR-DFD)
|
|