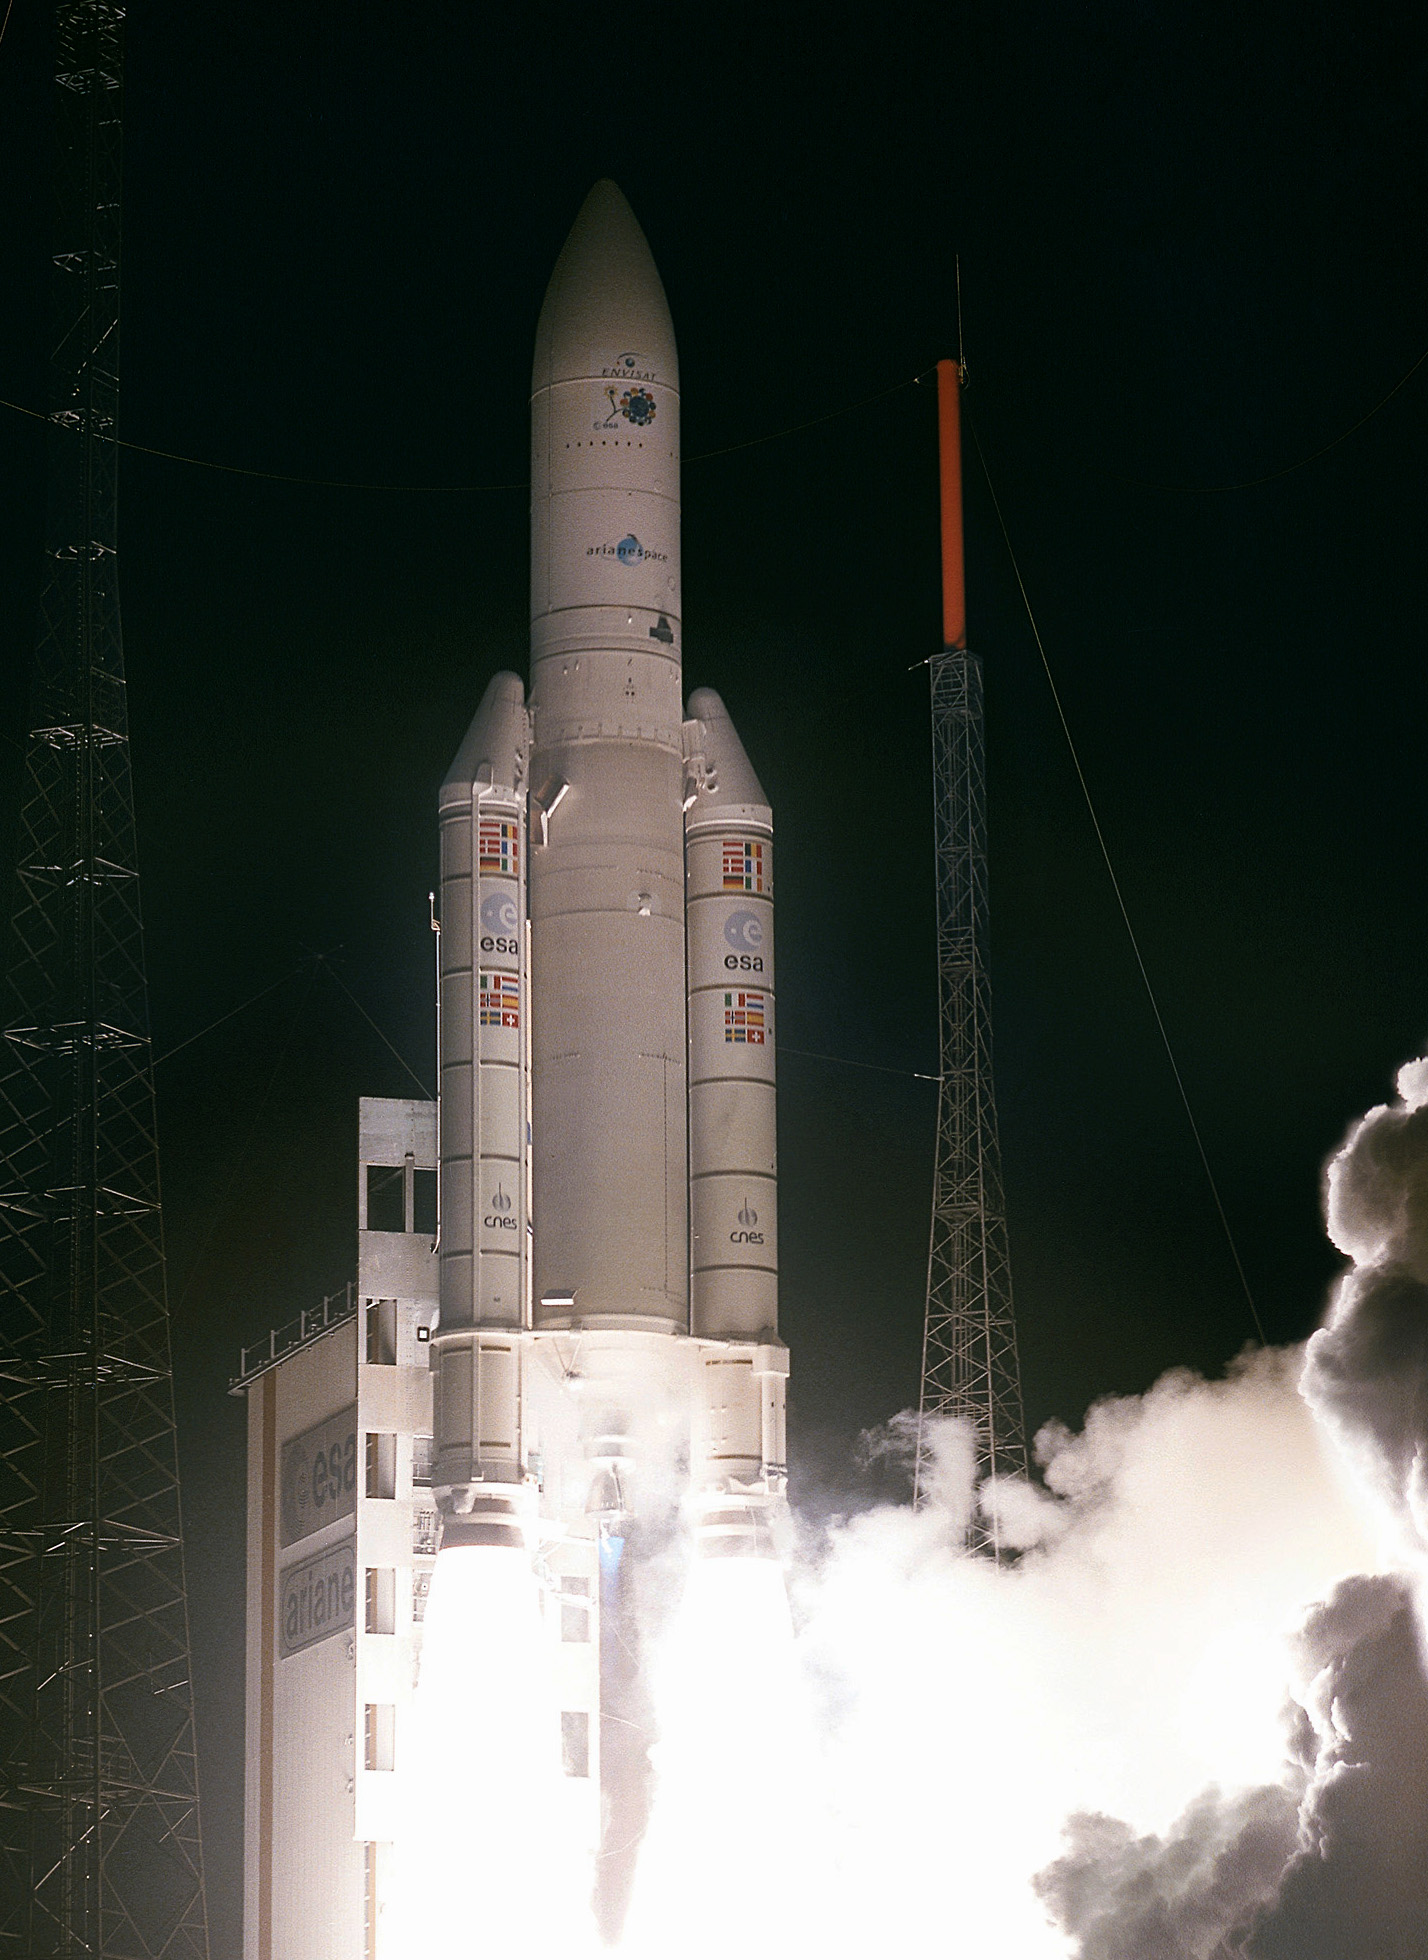
| Fig. 6-1 |
ENVISAT launch (Photo: ESA) |
|
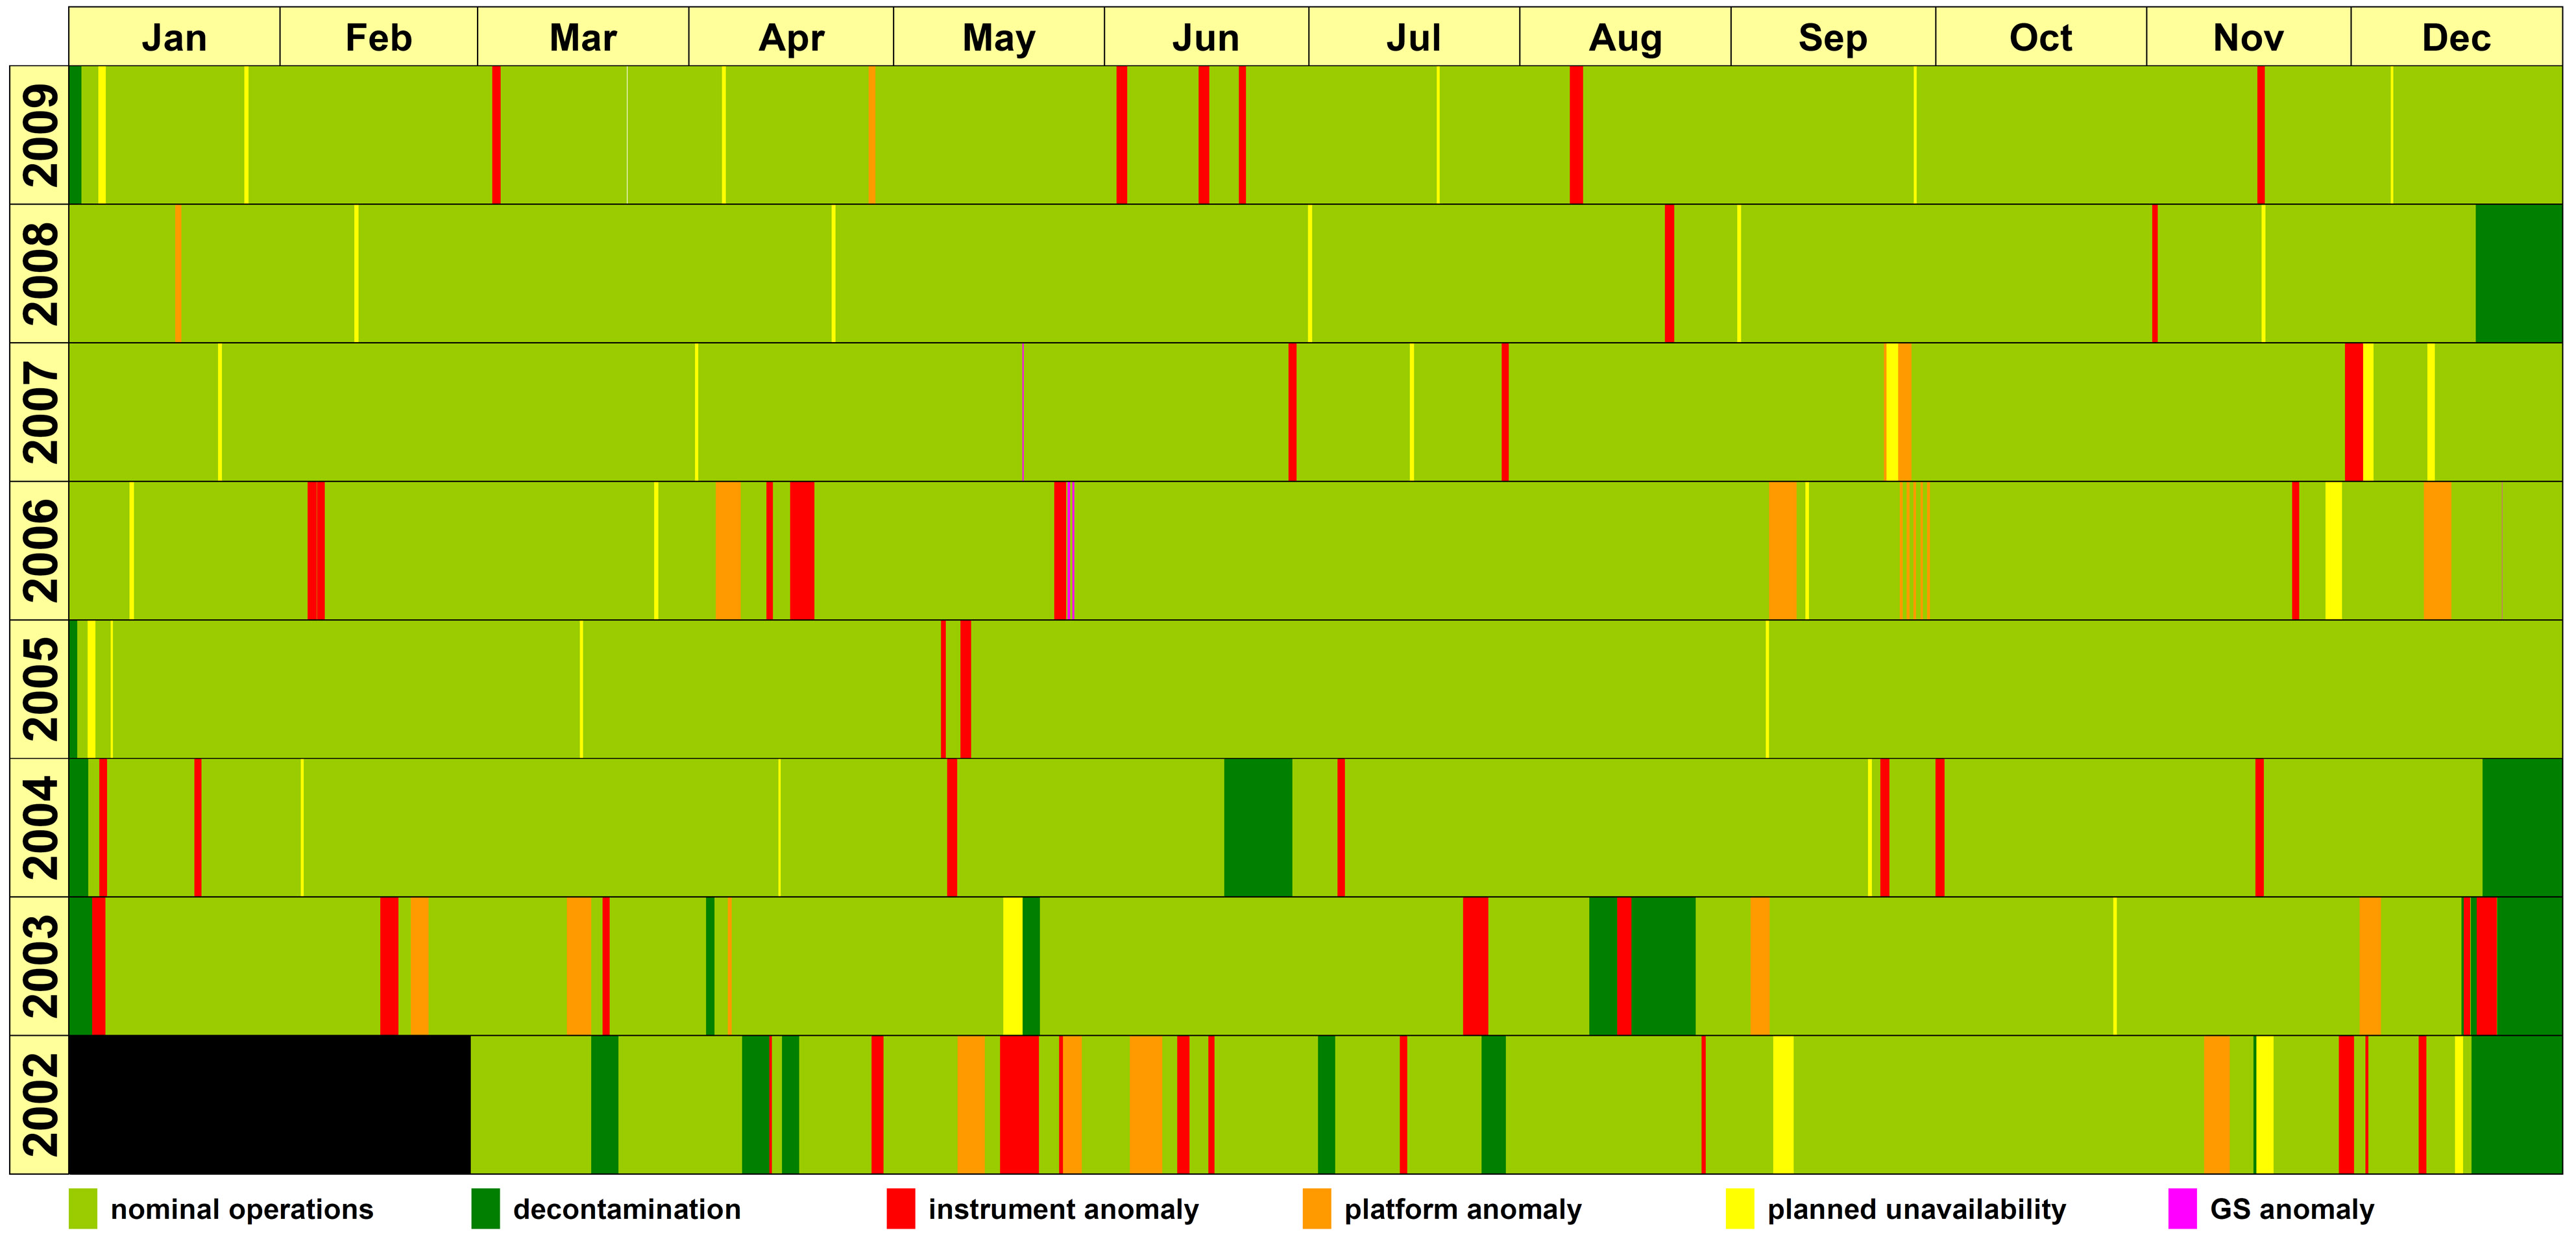
| Fig. 6-2 |
Operations summary for the commissioning and routine operations phase. Colour coding indicates instrument availability.
Courtesy: DLR-IMF) |
|
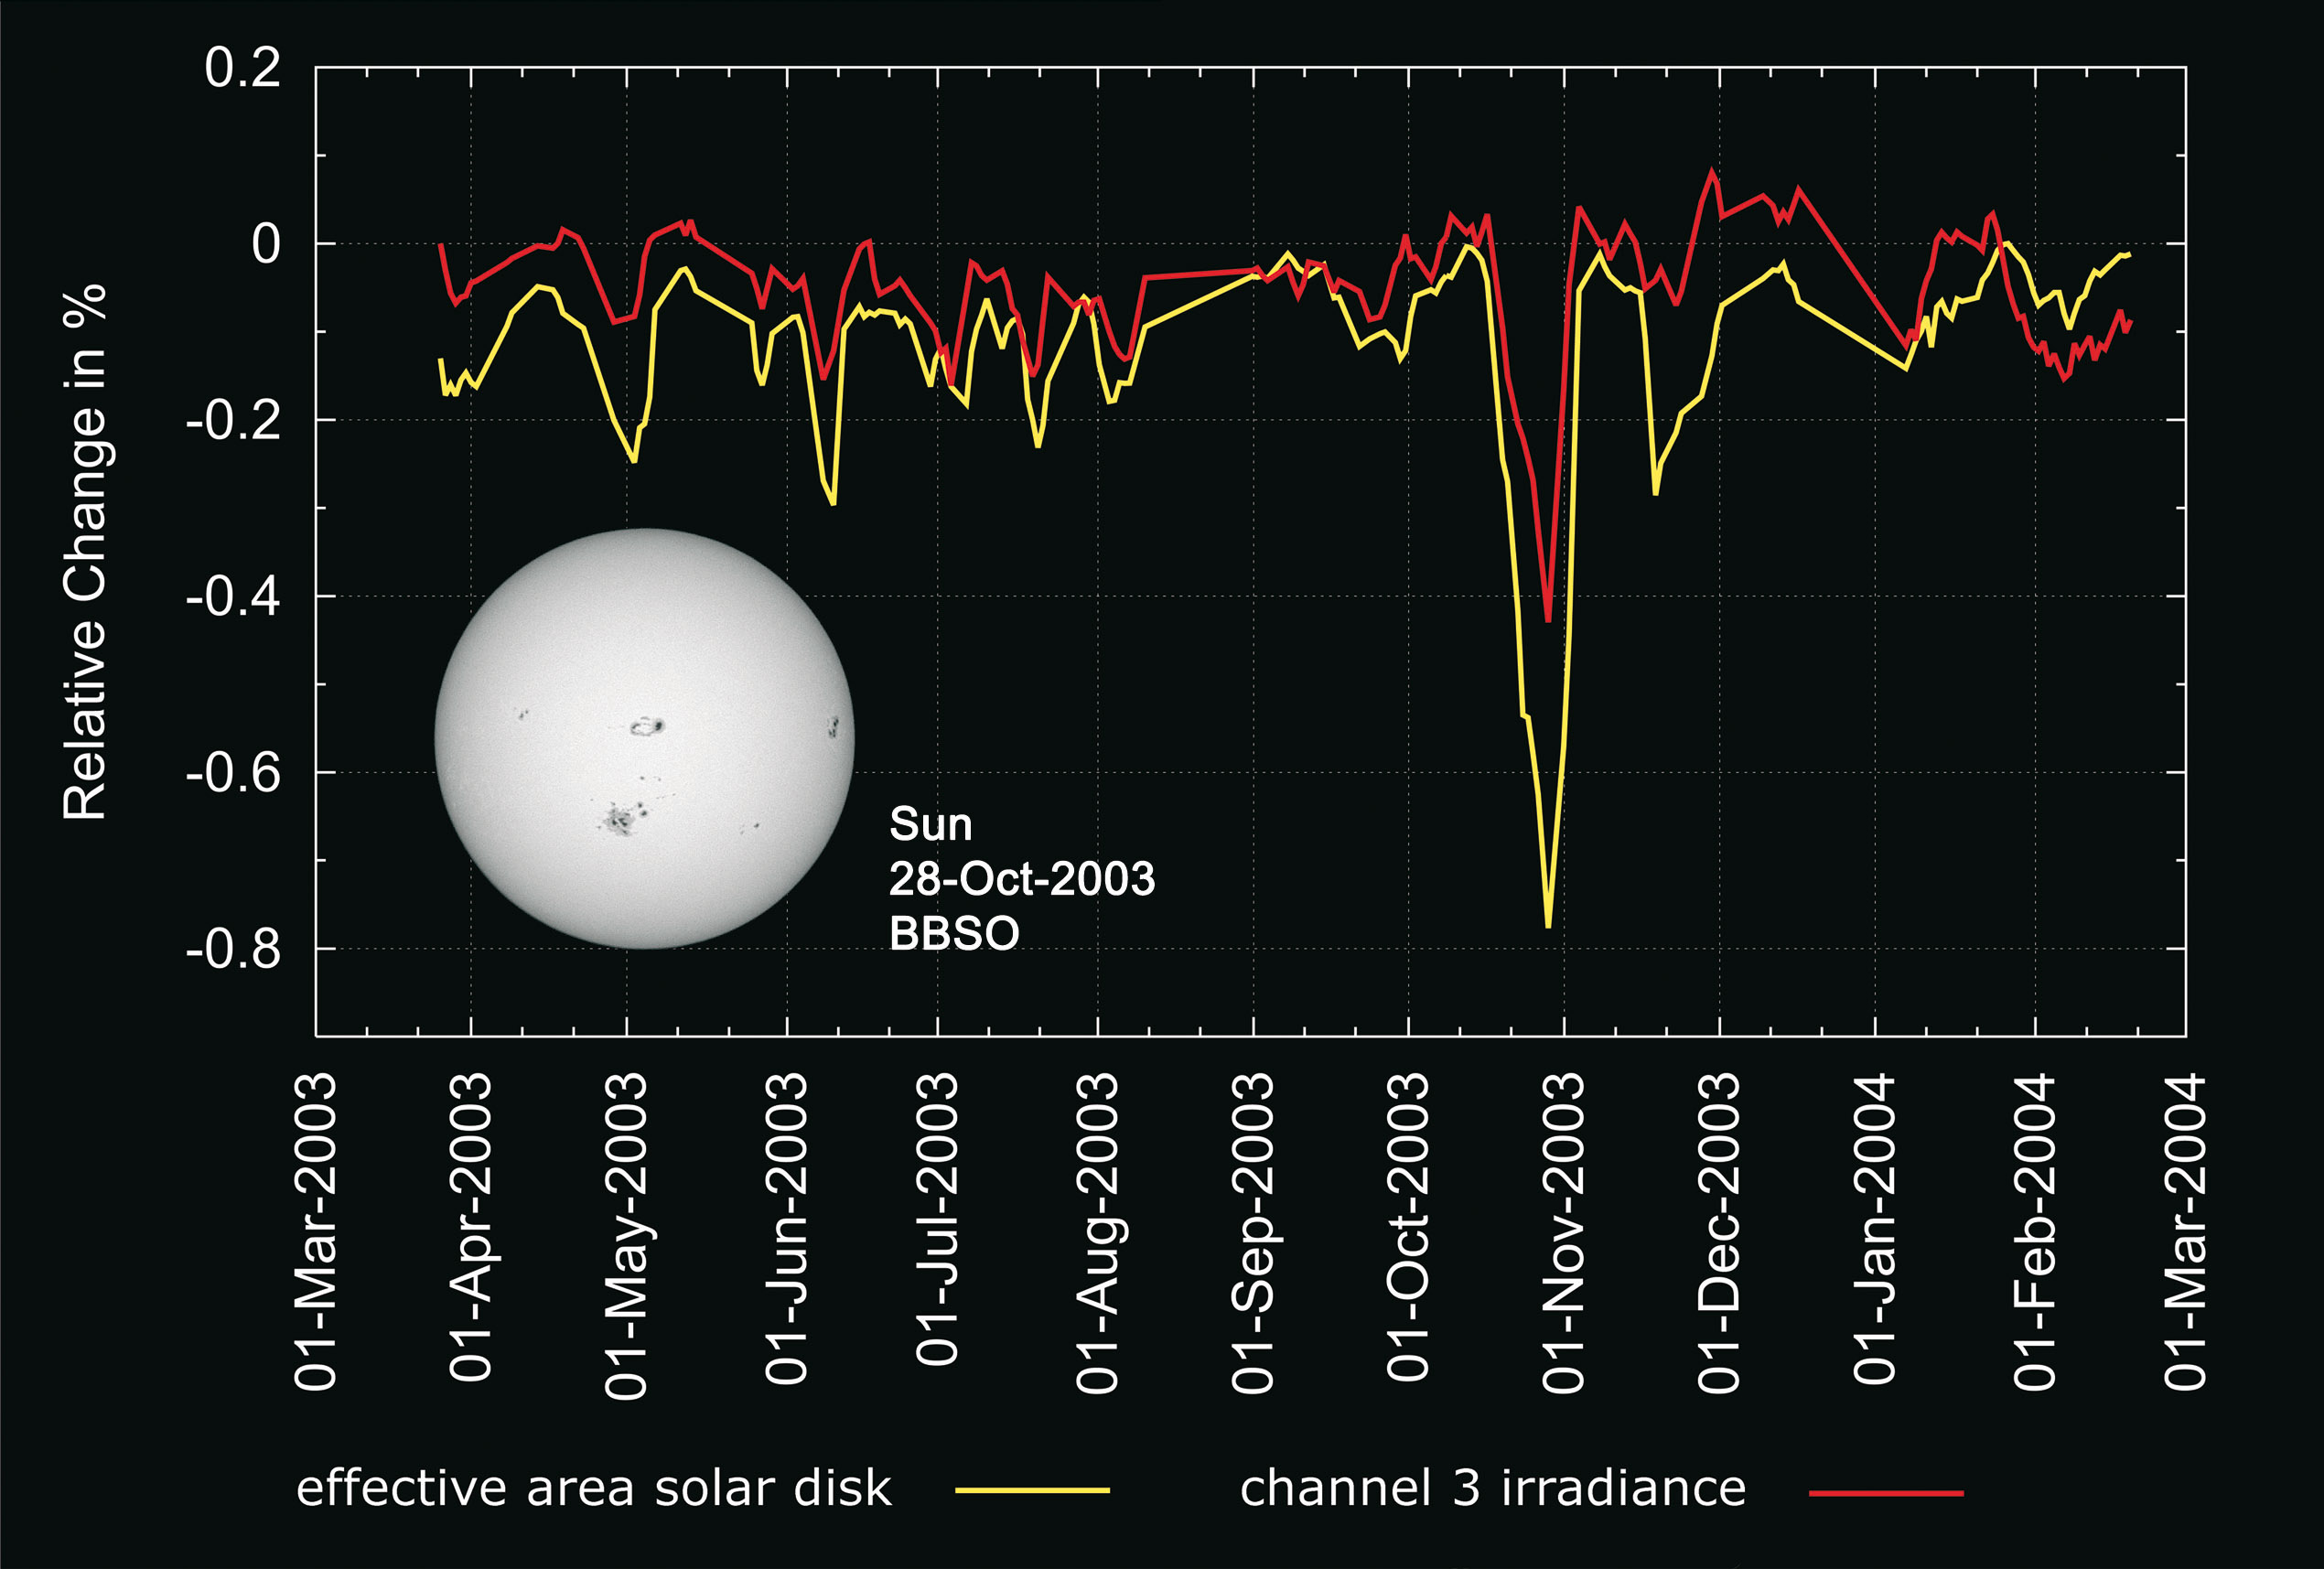
| Fig. 6-3 |
Measured irradiance in channel 3 (red) and effective solar disk area (yellow) between March 2003 and March 2004. The large sunspots at the end of October
caused a significantly reduced irradiance. The inset shows the active solar disk in white light on 28 October 2003.
(Courtesy: IUP-IFE, University of Bremen; Sun photo: Big Bear Solar Observatory) |
|
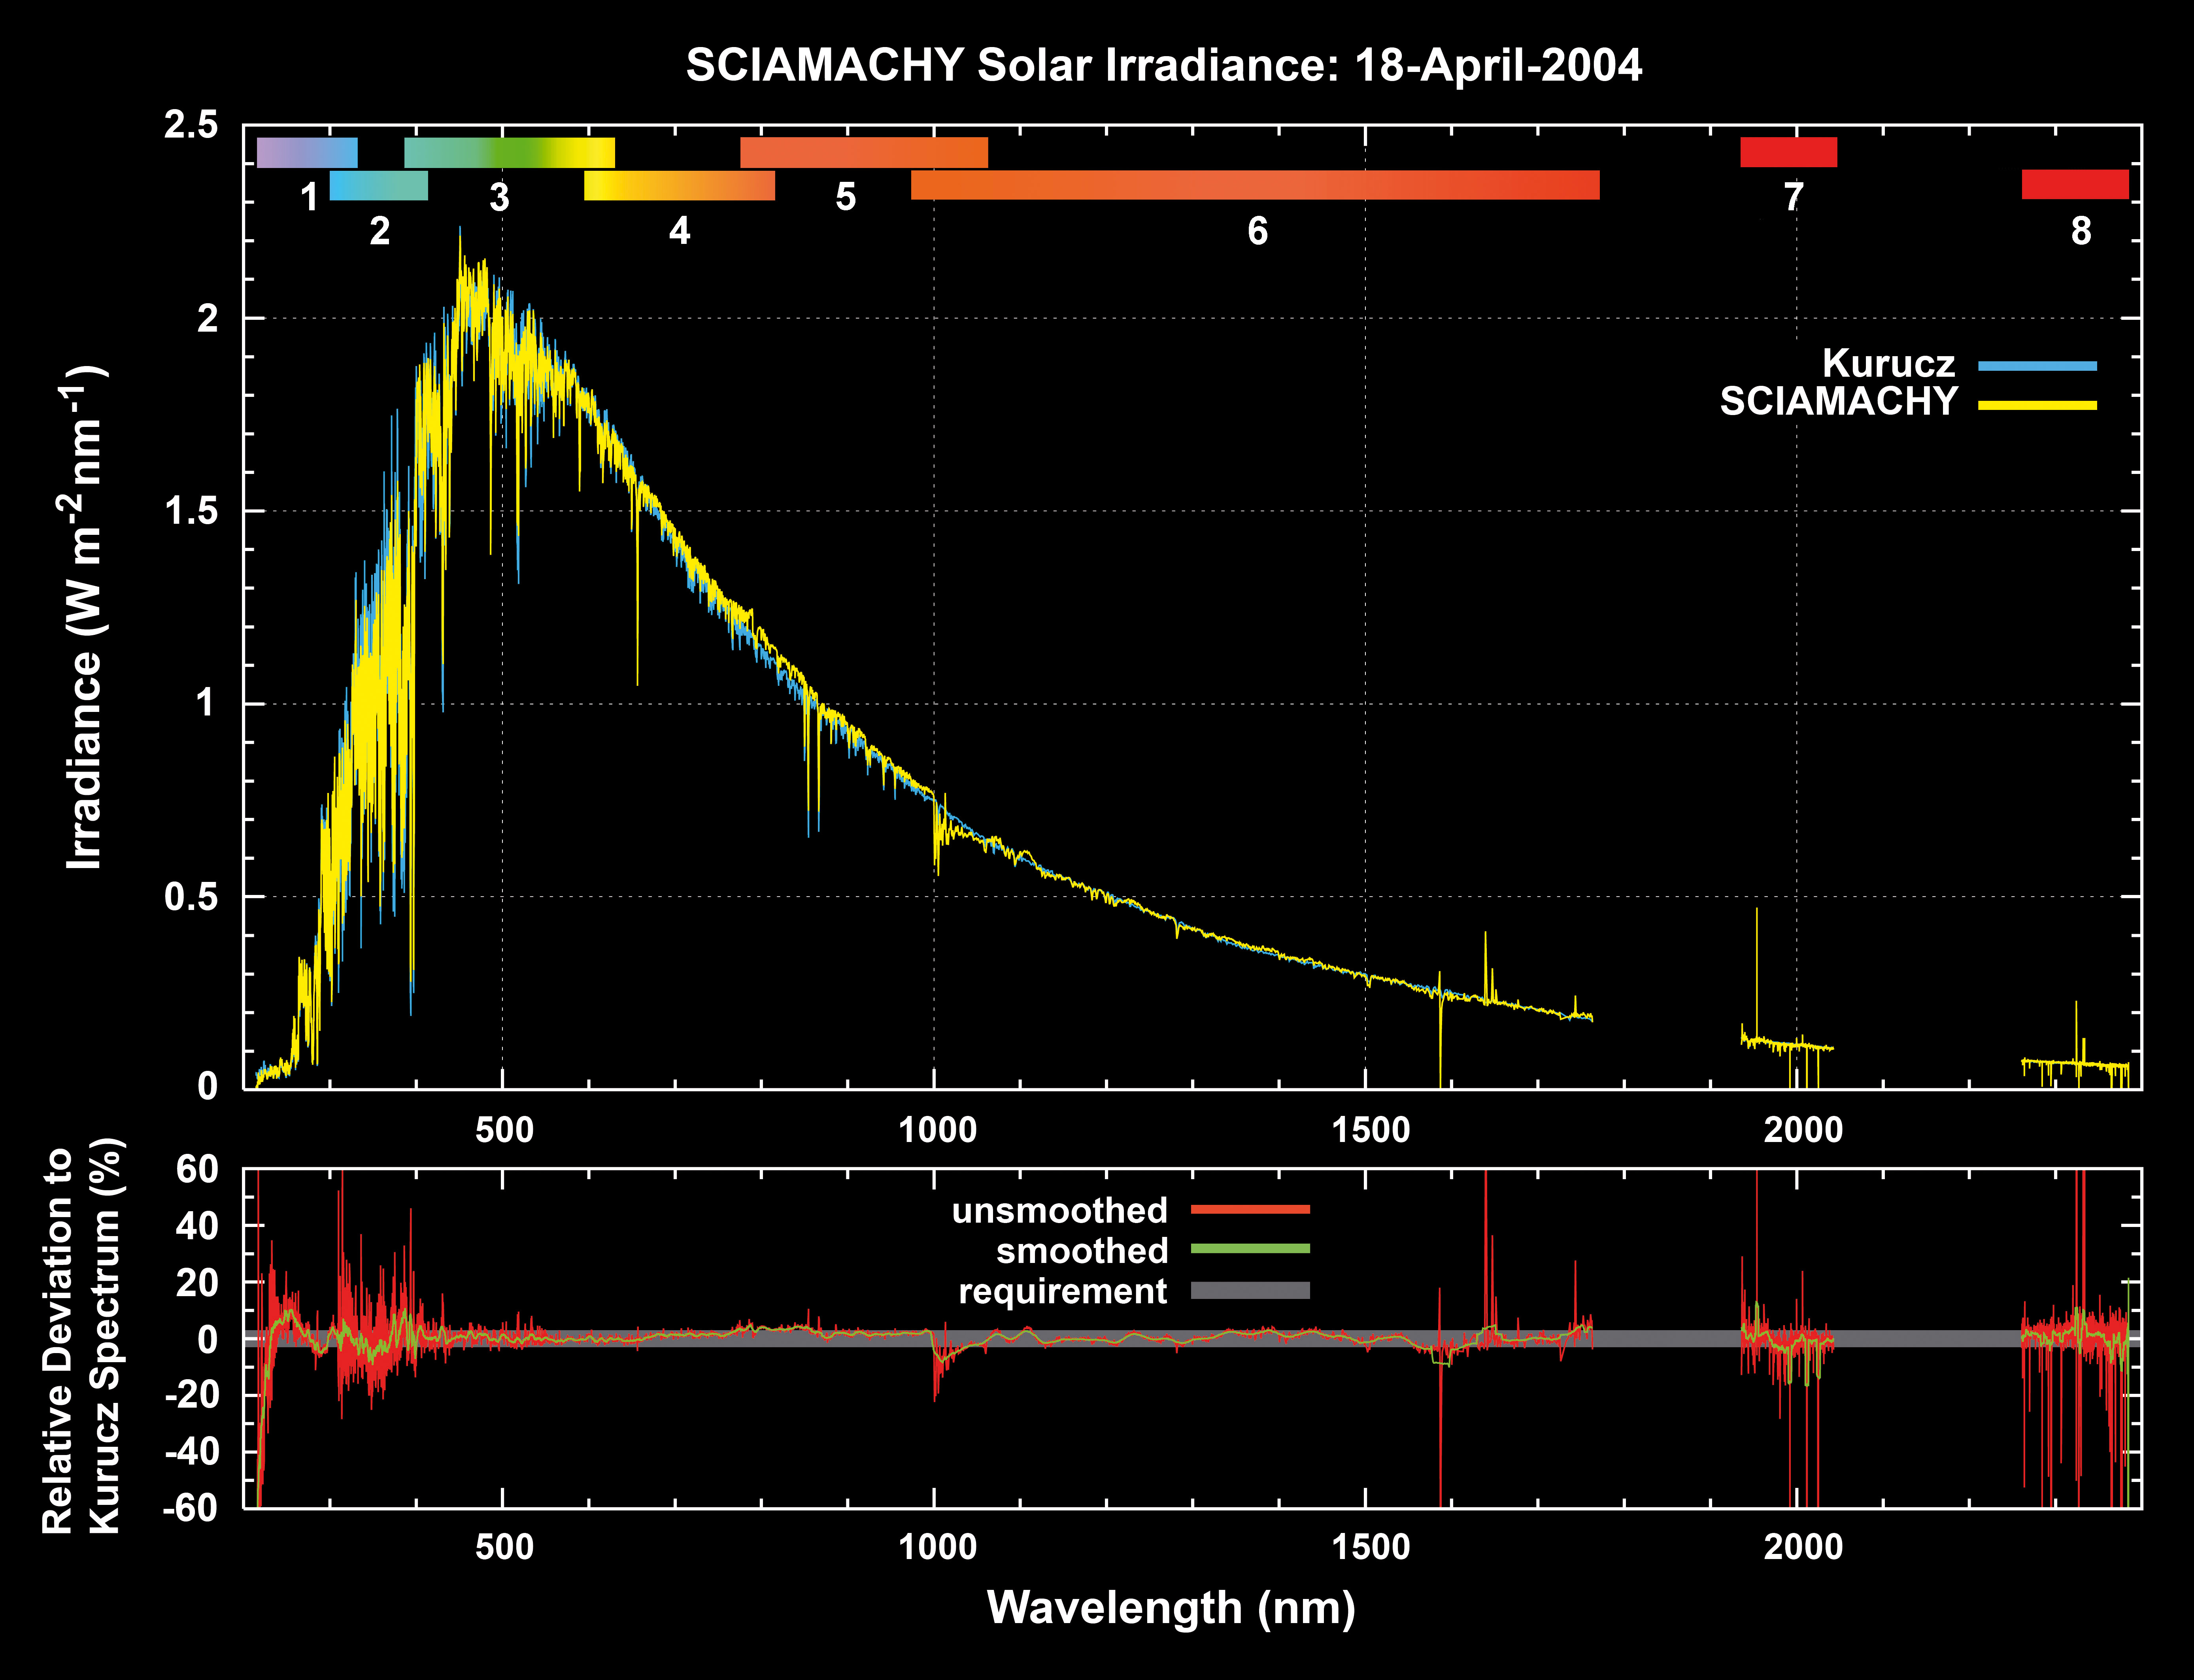
| Fig. 6-4 |
Calibrated SCIAMACHY solar irradiance spectrum measured on 18 April 2004, in comparison to the Kurucz solar reference spectrum. SCIAMACHY data have been
normalised to 1 AU solar distance. Kurucz data have been interpolated to the SCIAMACHY wavelength grid. Top: SCIAMACHY (yellow) and Kurucz
(blue) irradiance as function of wavelength with the wavelength coverage of all 8 channels. Bottom: Relative deviation between the two data sets.
Small deviations in the wavelength calibration can cause large fluctuations in the ratio of the spectra. Therefore, the deviation is shown as
unsmoothed (red) and smoothed (green) curve. The underlying grey bar shows the ±3% requirement for the absolute radiometric calibration of
SCIAMACHY which is fulfilled over almost the whole spectral range. (Courtesy: IUP-IFE, University of Bremen) |
|
| Fig. 6-5 |
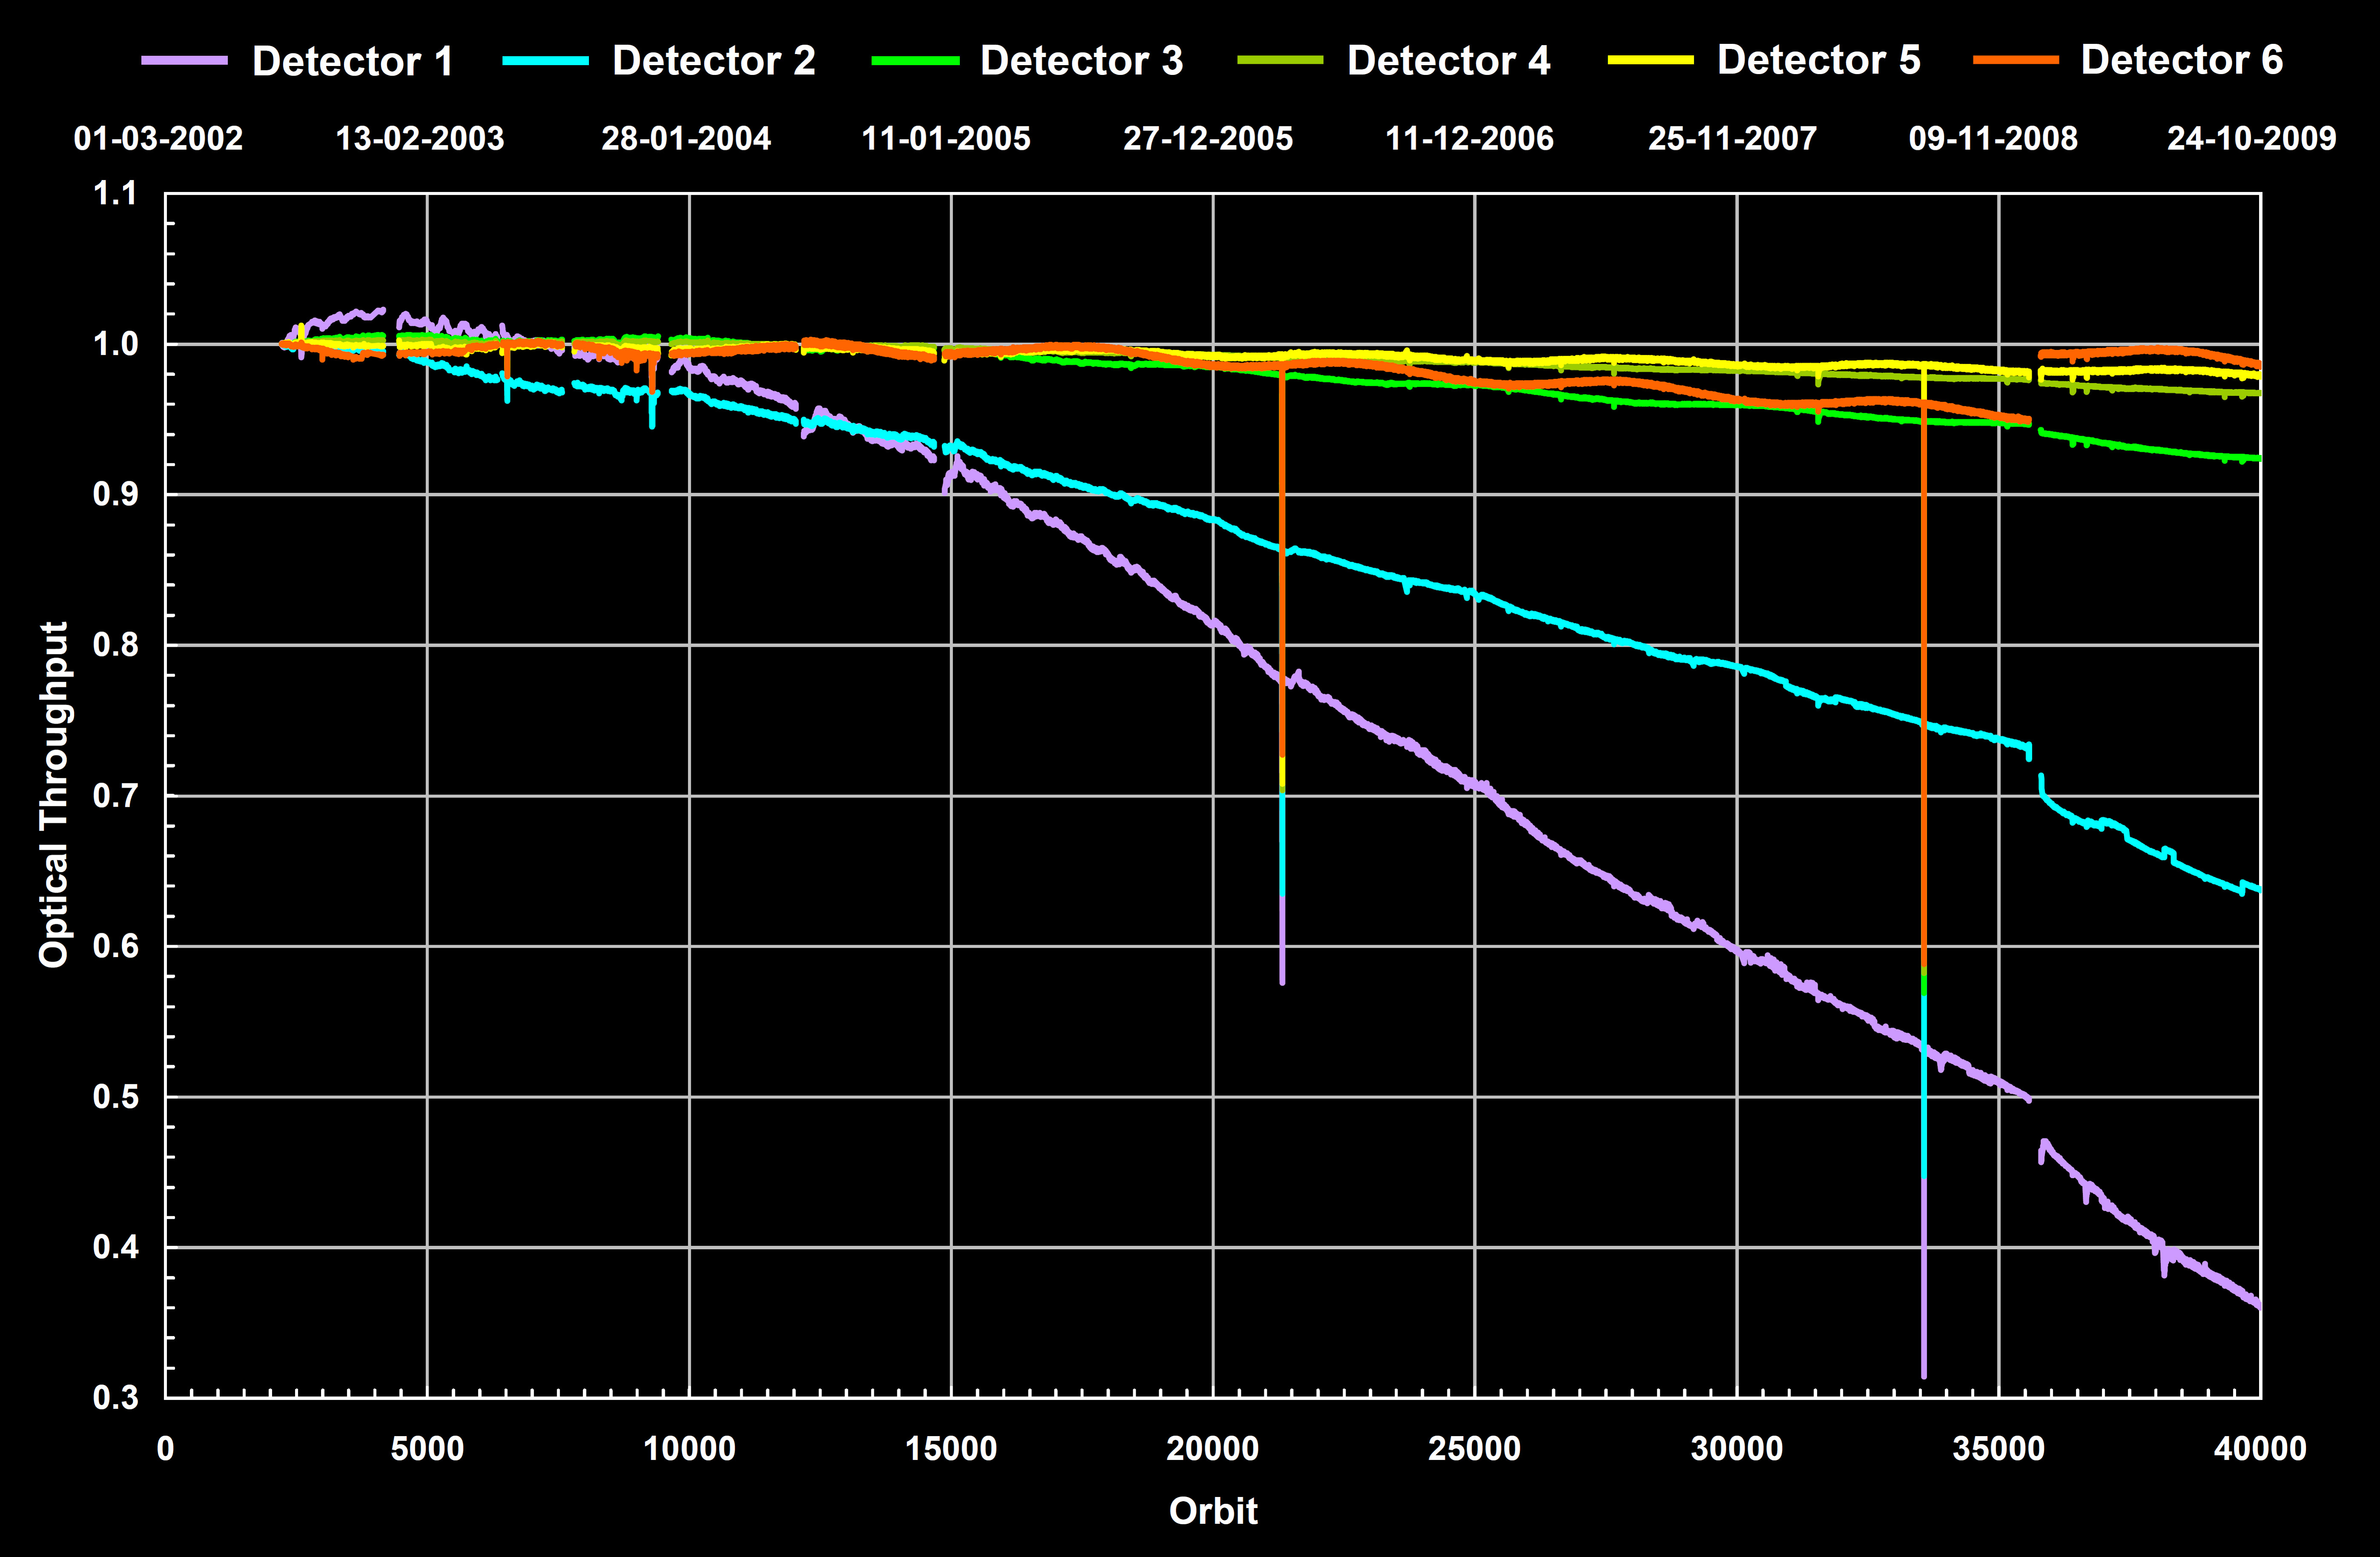
Seven years of optical throughput for channels 1-6 starting with quasi-routine measurements on 2 August 2002. Decontamination
intervals and periods after instrument saving are omitted. The information has been derived from the operational light
path monitoring using the Sun via the ASM and ESM mirror. The two strong temporal reductions just before orbit
22000 and 34000 are caused by total solar eclipses. (Courtesy: IUP-IFE, University of Bremen) |
 |
| Fig. 6-6 |
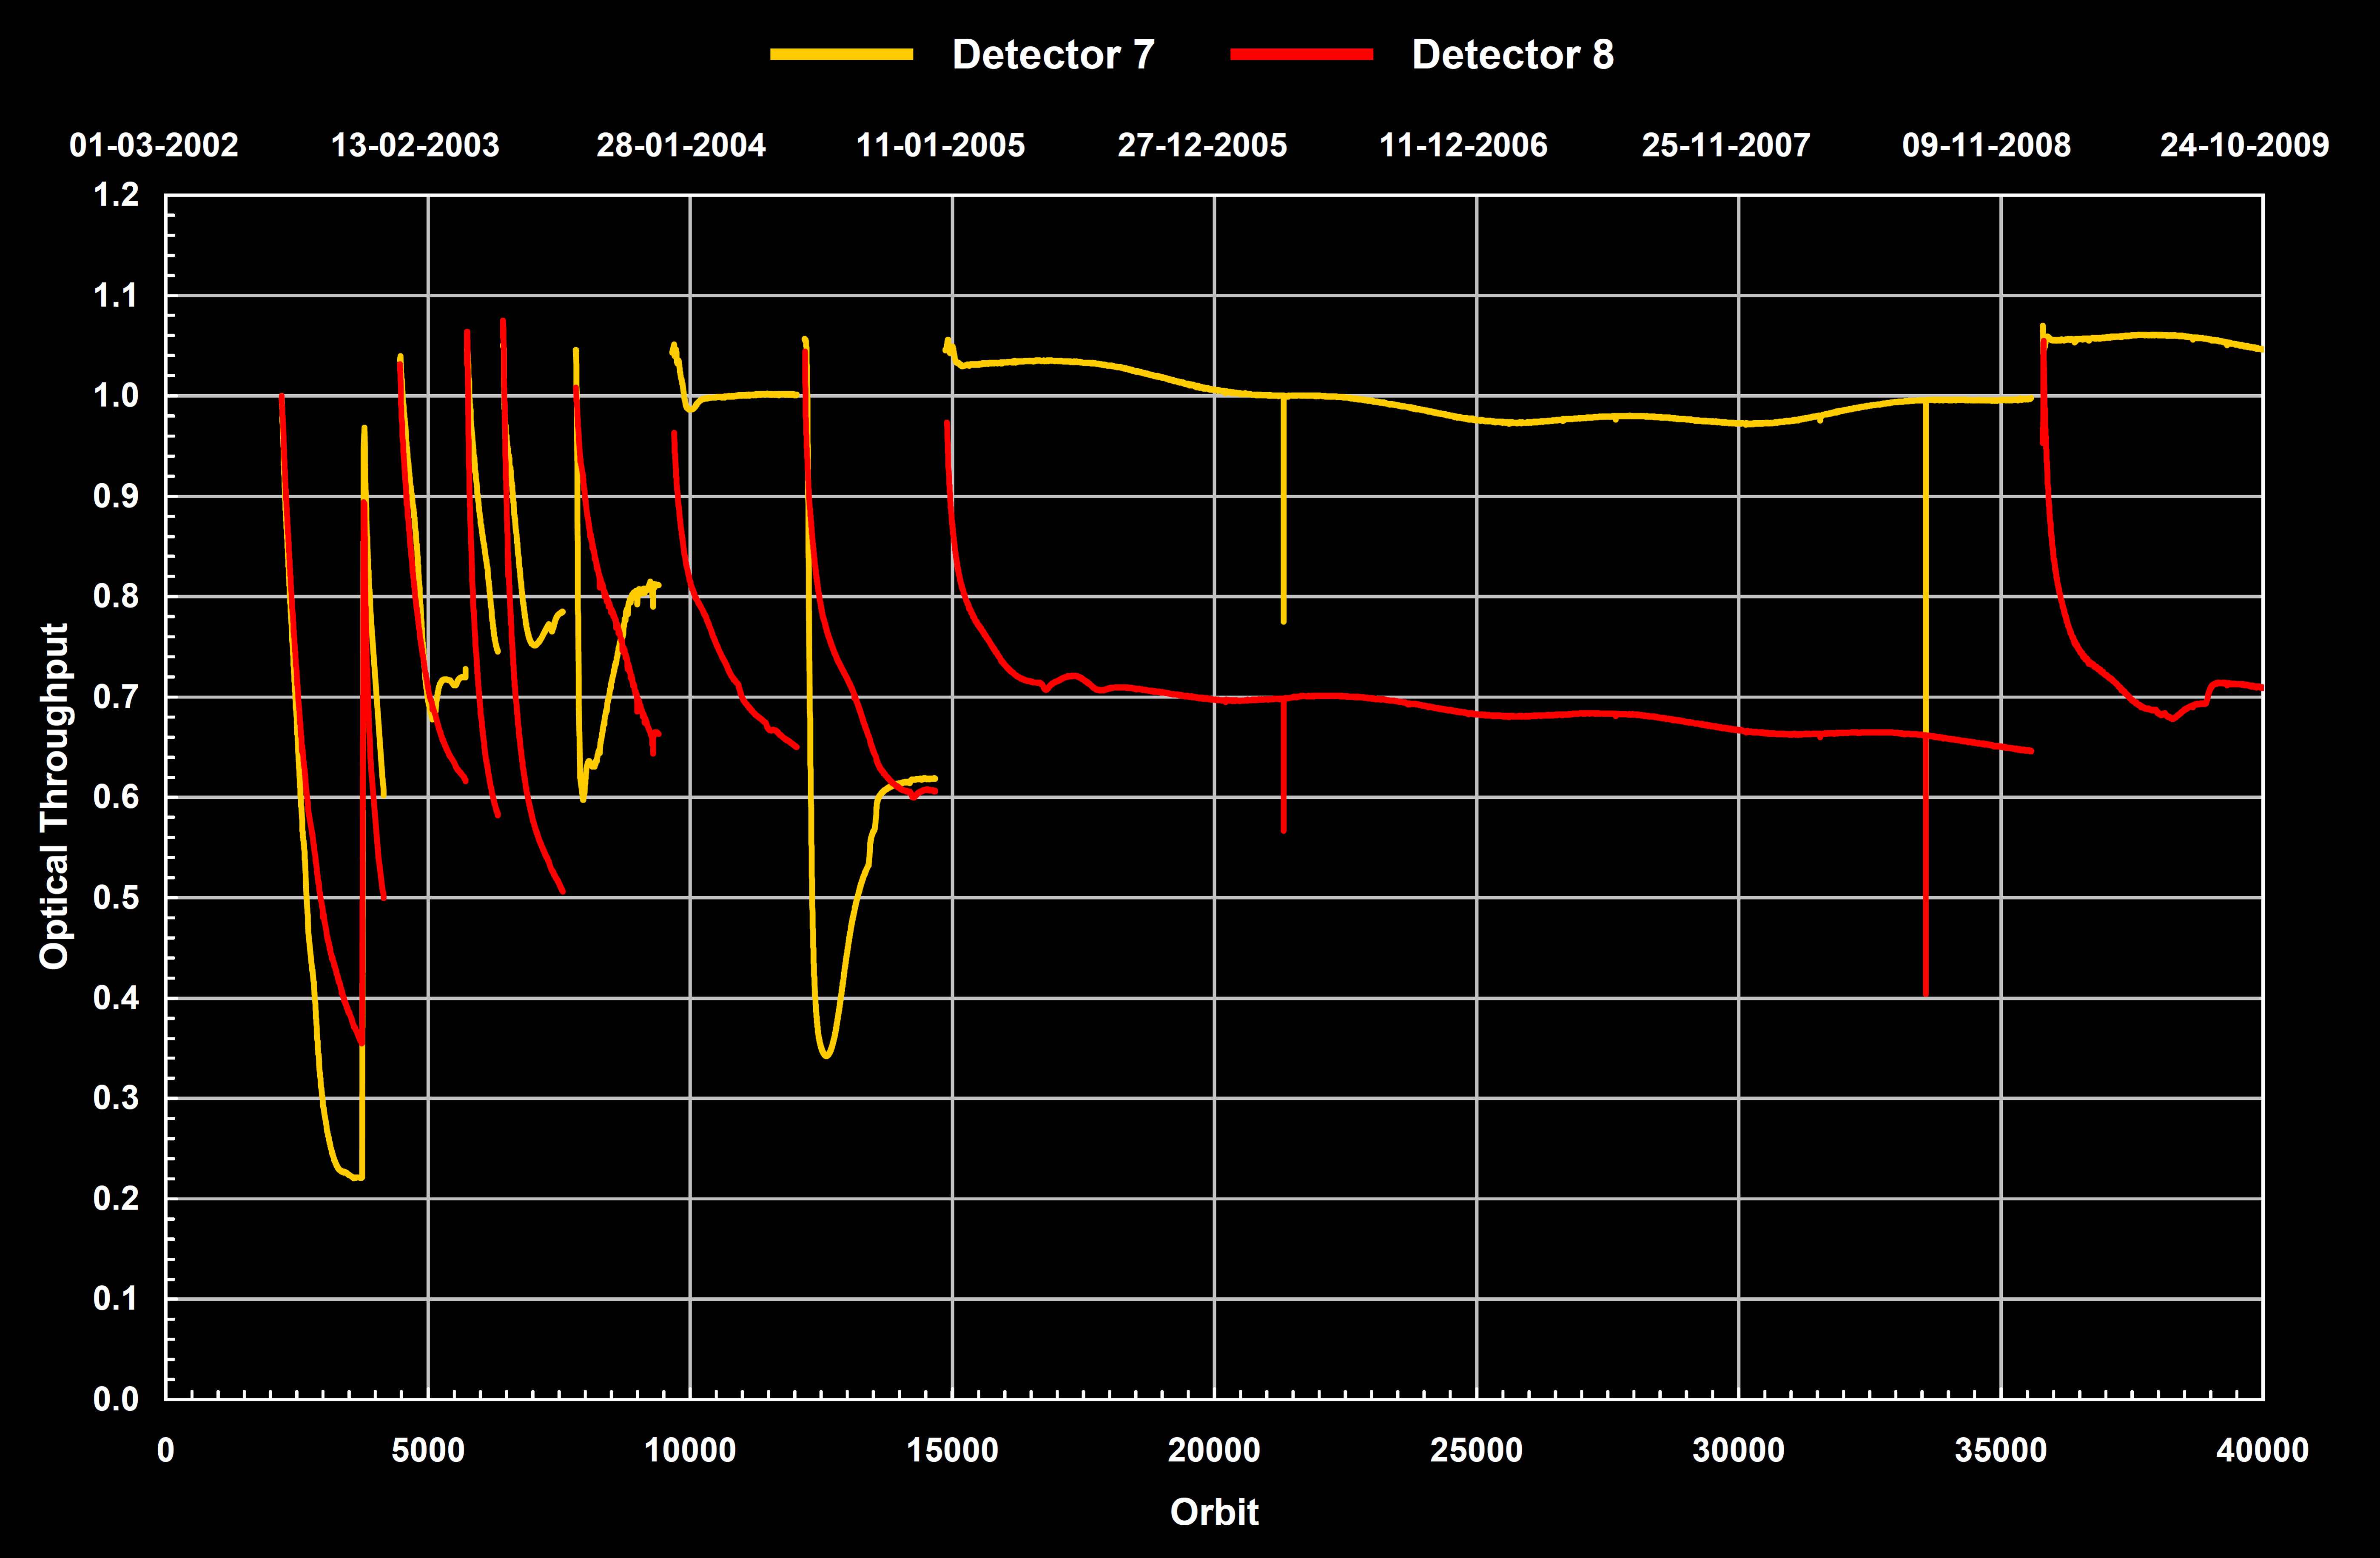
Optical throughput for the SWIR channels 7 and 8. Similarly to Fig. 6-15, a growing ice layer and its decontamination induced
evaporation determines the shape of the curve. (Courtesy: IUP-IFE, University of Bremen) |
 |
| Fig. 6-7 |
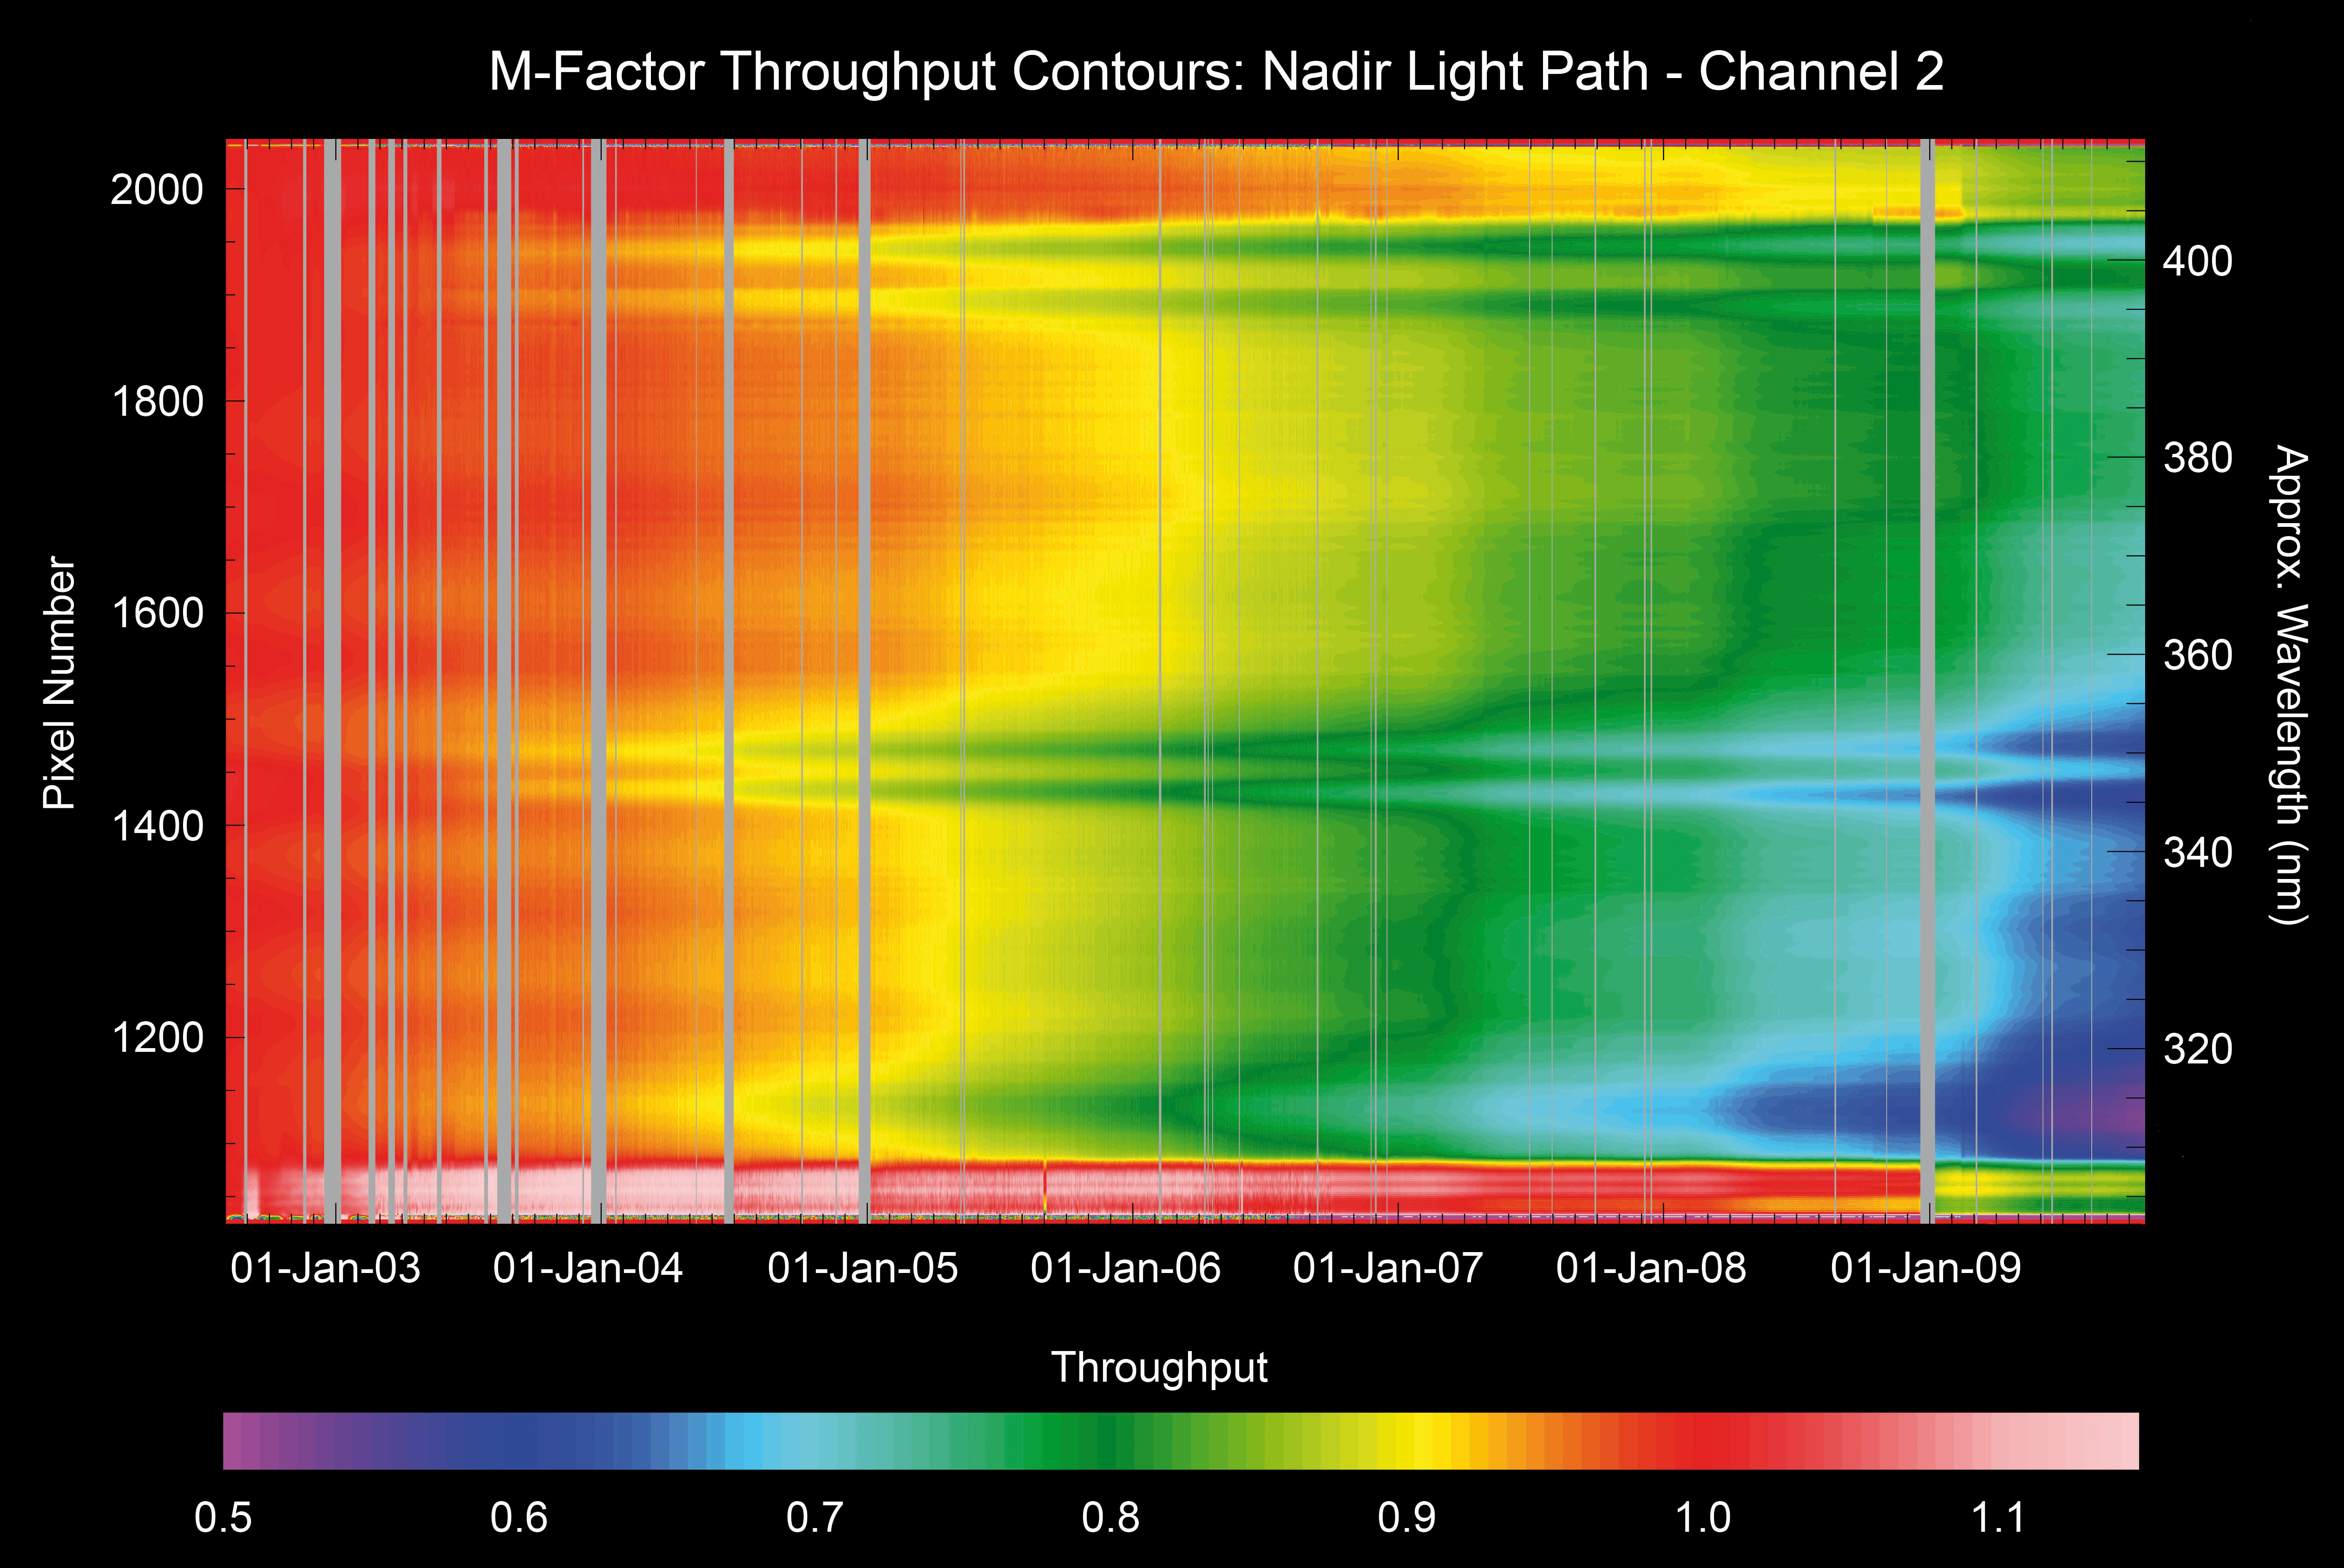
Variation of the throughput of the SCIAMACHY nadir light path in channel 2, determined from m-factors. The contours plot
shows the spectrally resolved throughput as a function of time. Grey bars mask out times of reduced instrument performance,
i.e. switch-offs or decontamination periods. (Courtesy: IUP-IFE, University of Bremen) |
|
| Fig. 6-8 |
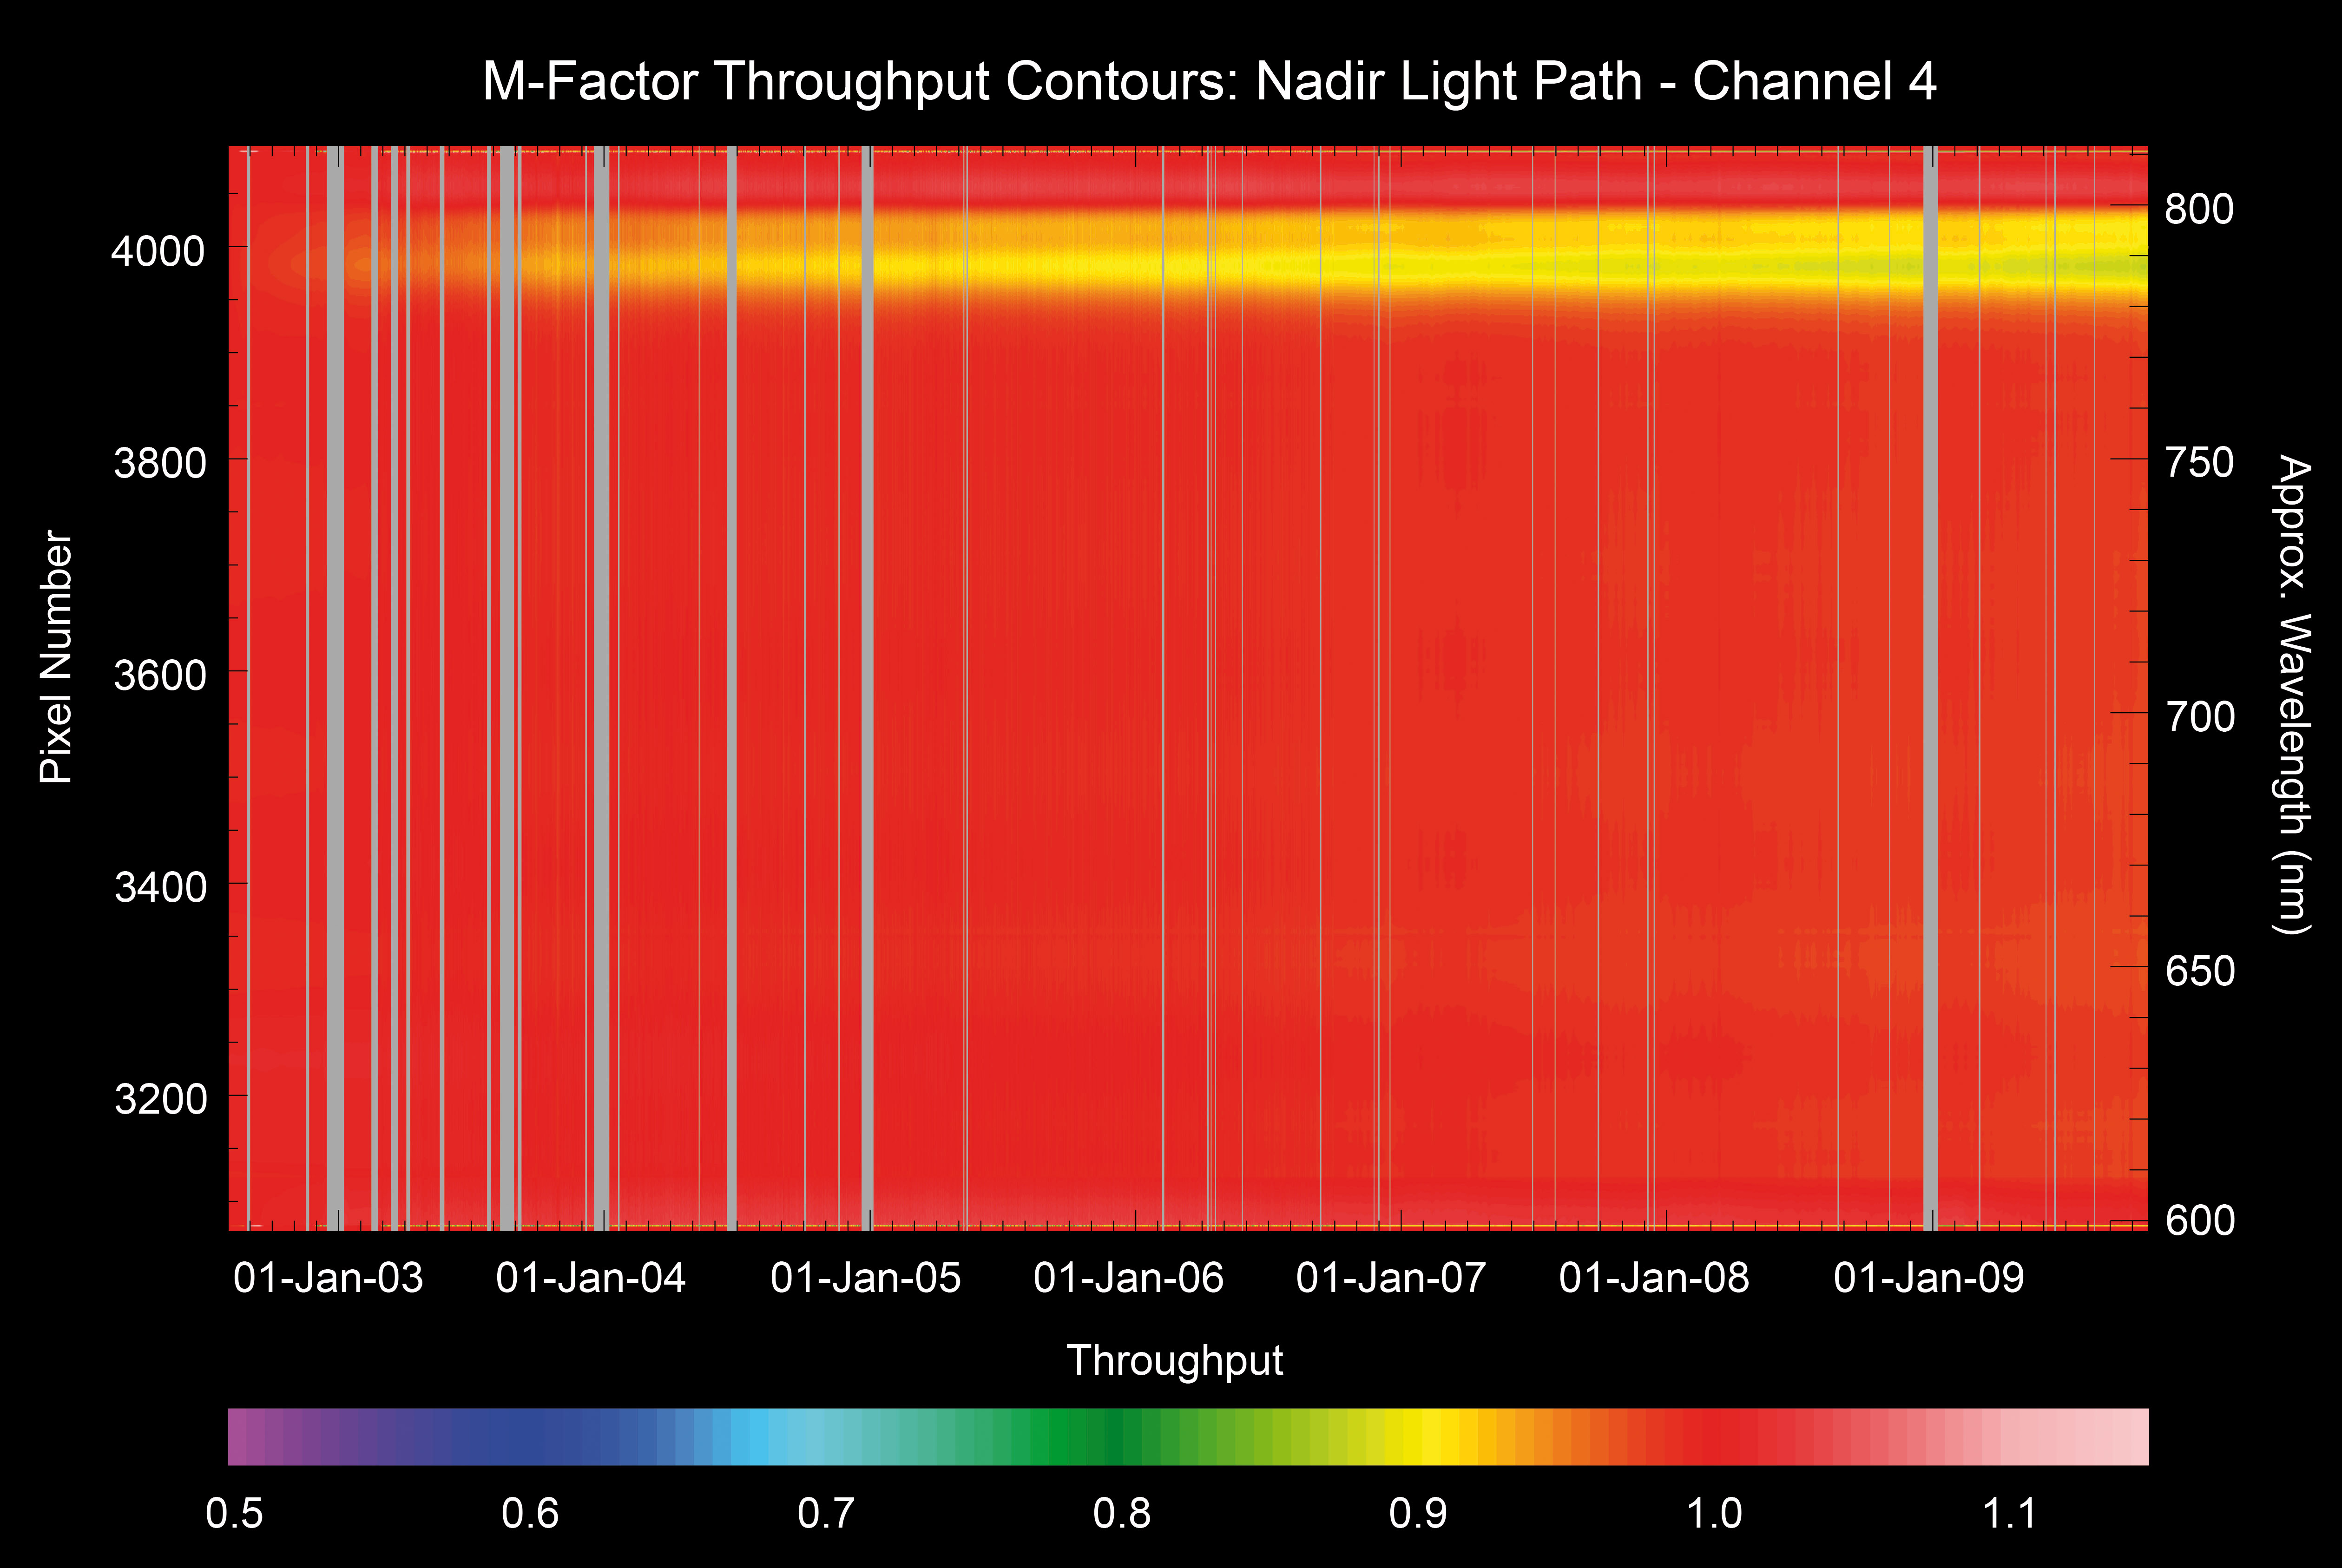
Same as Fig. 6-7, but for SCIAMACHY channel 4. (Courtesy: IUP-IFE, University of Bremen) |
 |
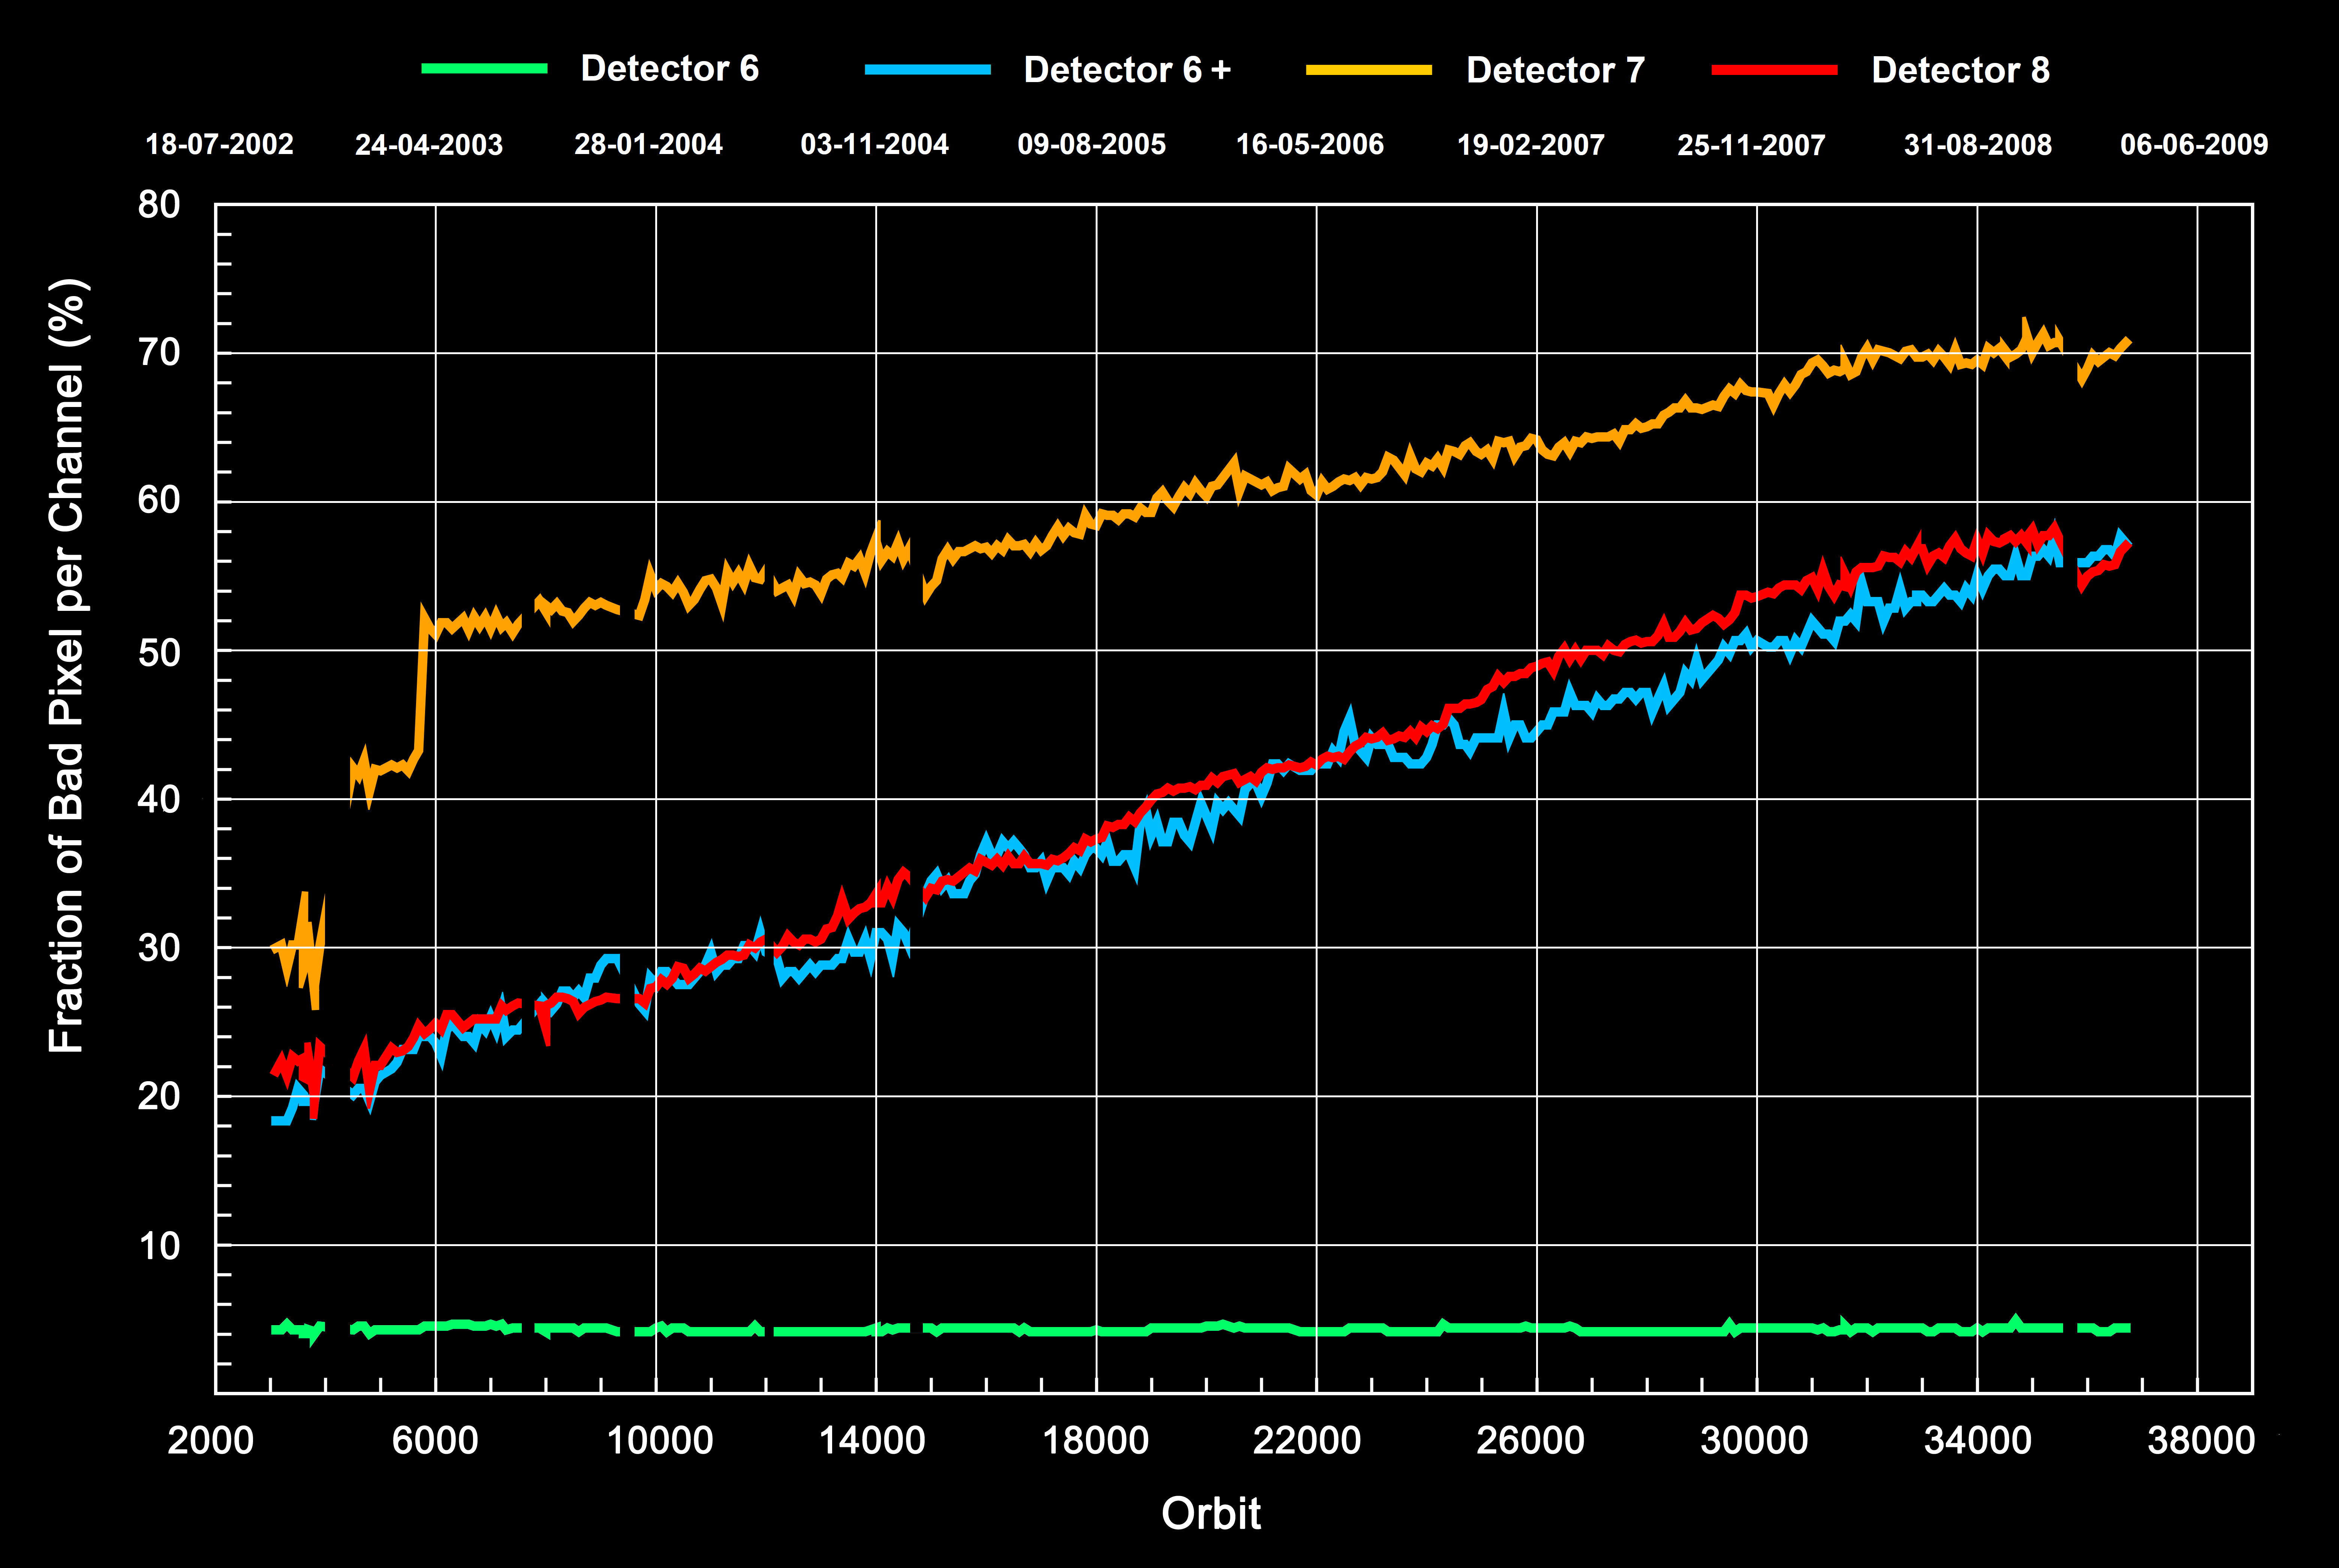
| Fig. 6-9 |
Degradation of the pixel quality in the SWIR channels. The number of bad pixels is continuously increasing.
For comparison, the first half of channel 6 is illustrated which consists of a material being more robust in the
space environment and is thus much less subject to degradation. (Courtesy: SRON) |
 |
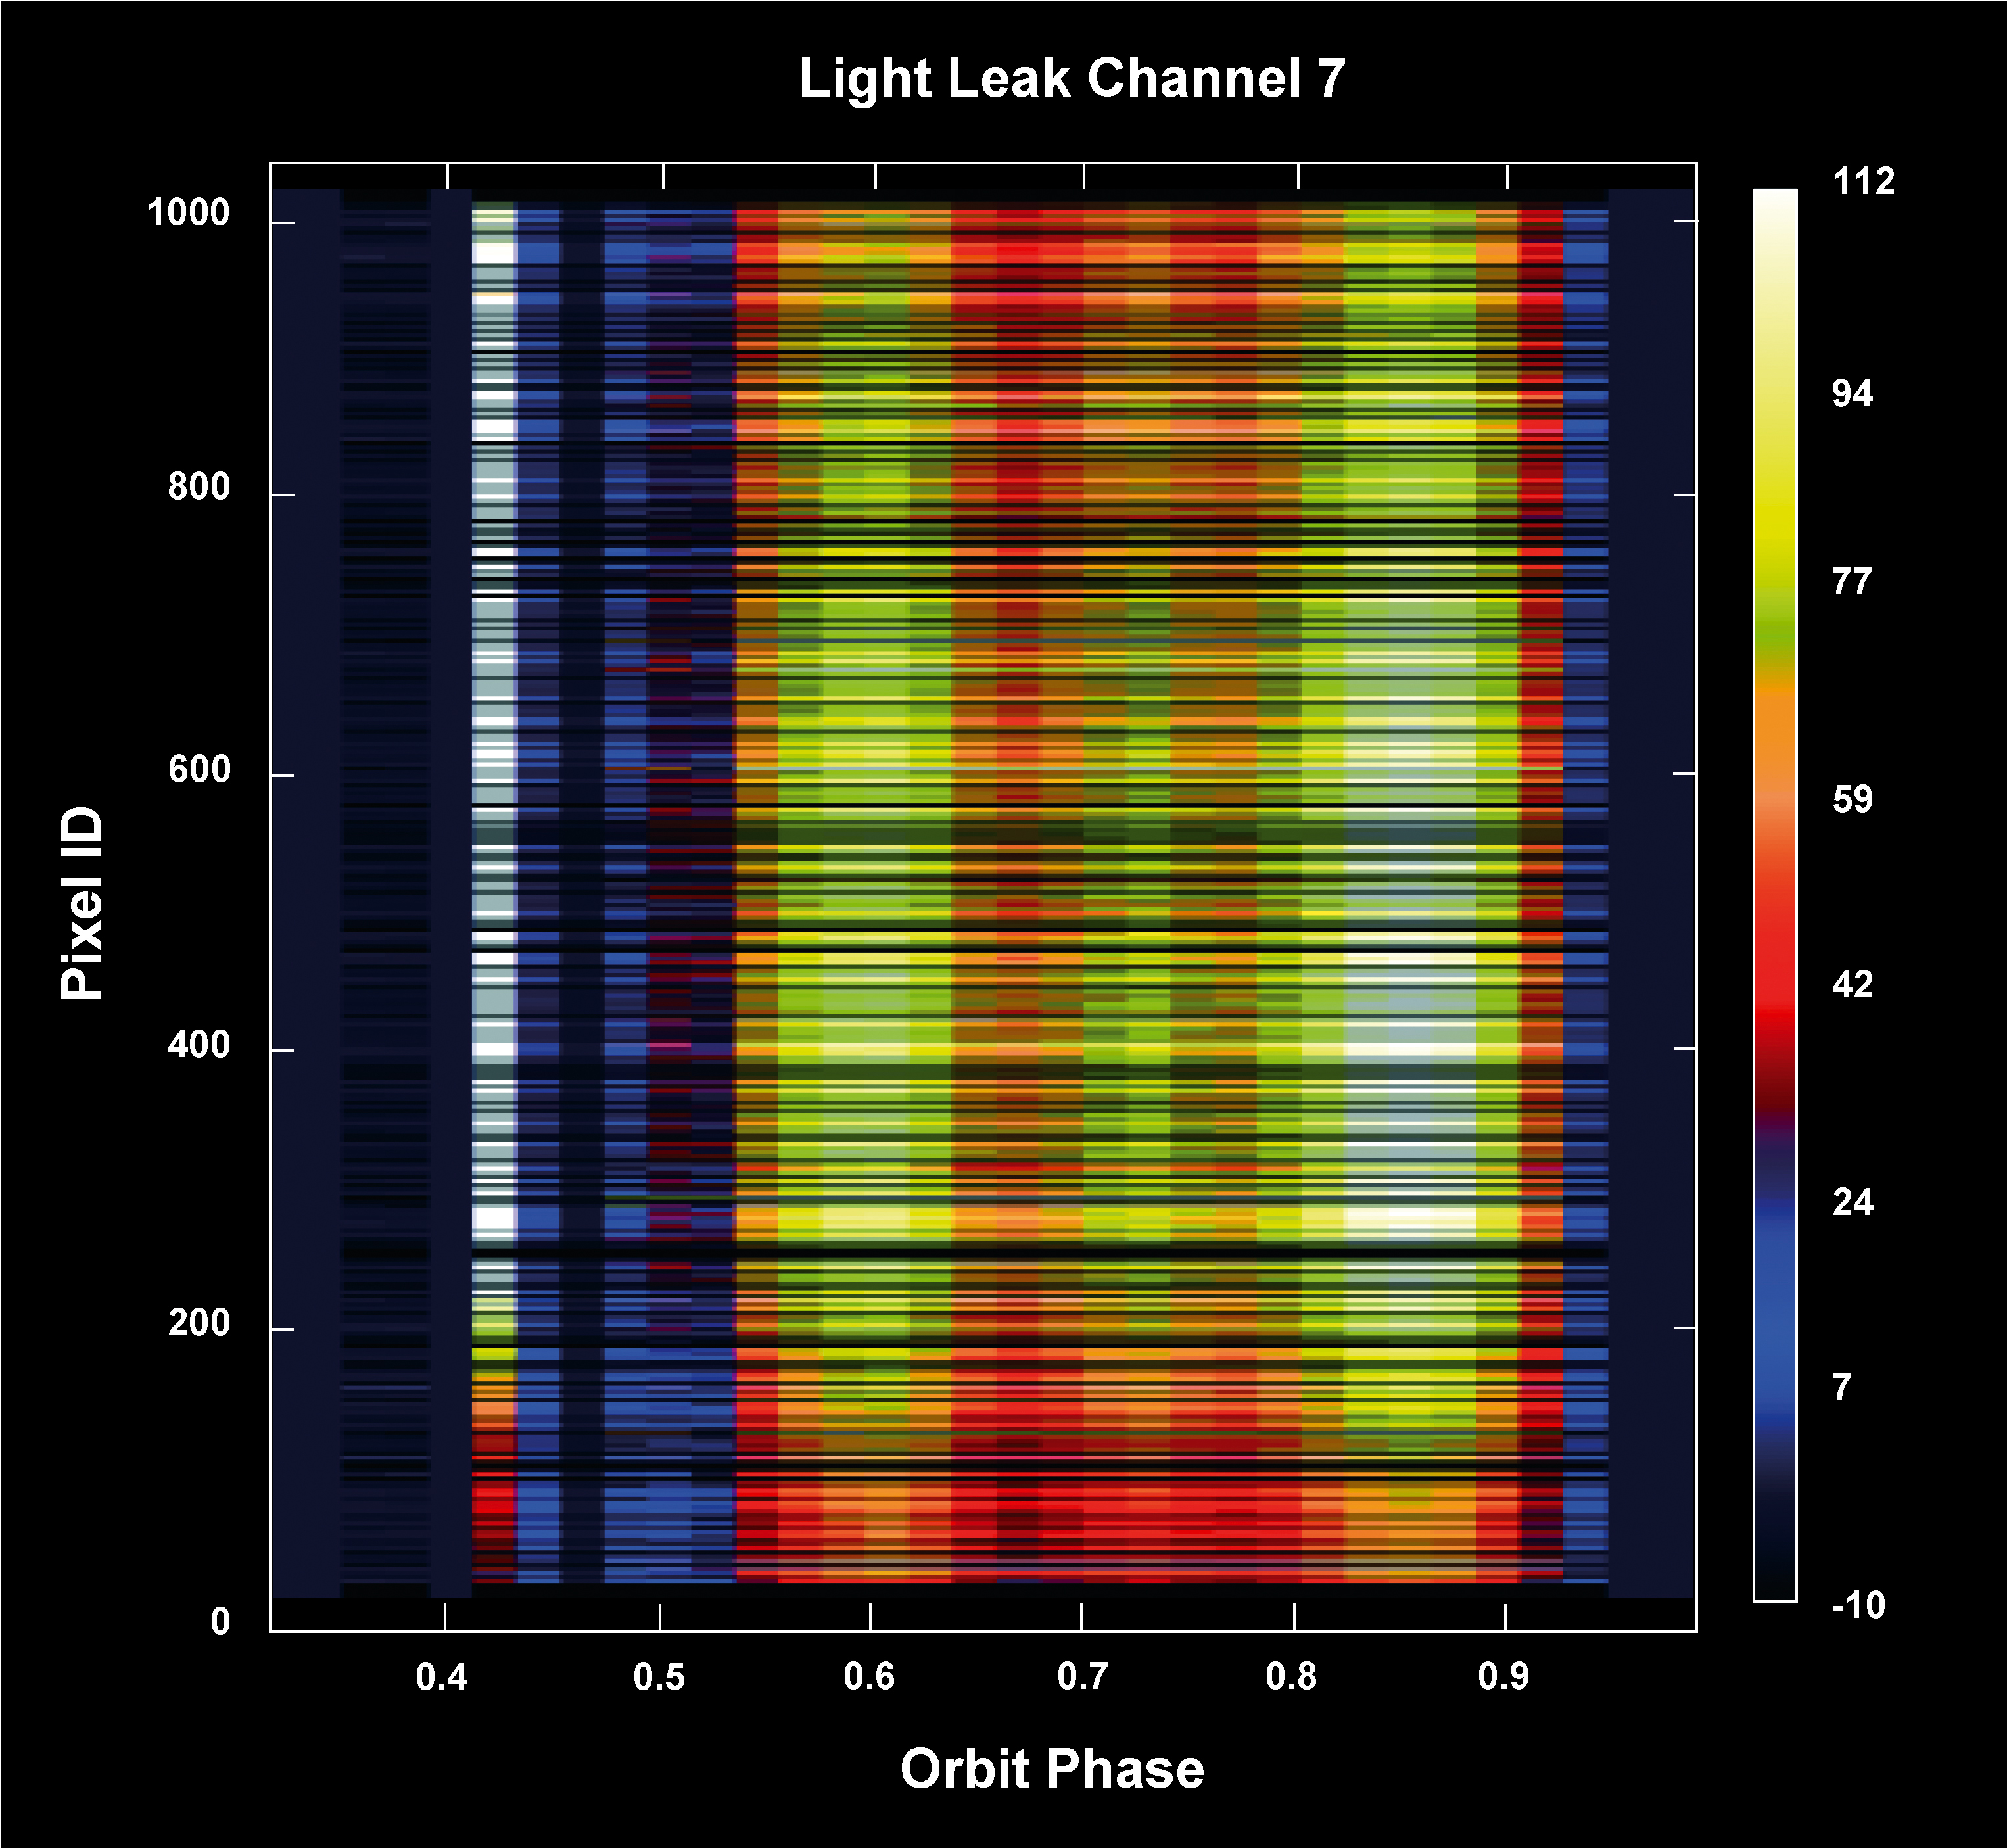
| Fig. 6-10 |
Mean light leak signal for all pixels in channel 7 as a function of orbit phase. The x-axis shows the orbit phase (eclipse corresponds to phase 0.95-0.40,
sunrise occurs at phase 0.41), the y-axis the pixel number in channel 7. The colours indicate the size of the light leak signal in BU/sec.
(Courtesy: DLR-IMF/SRON) |
 |
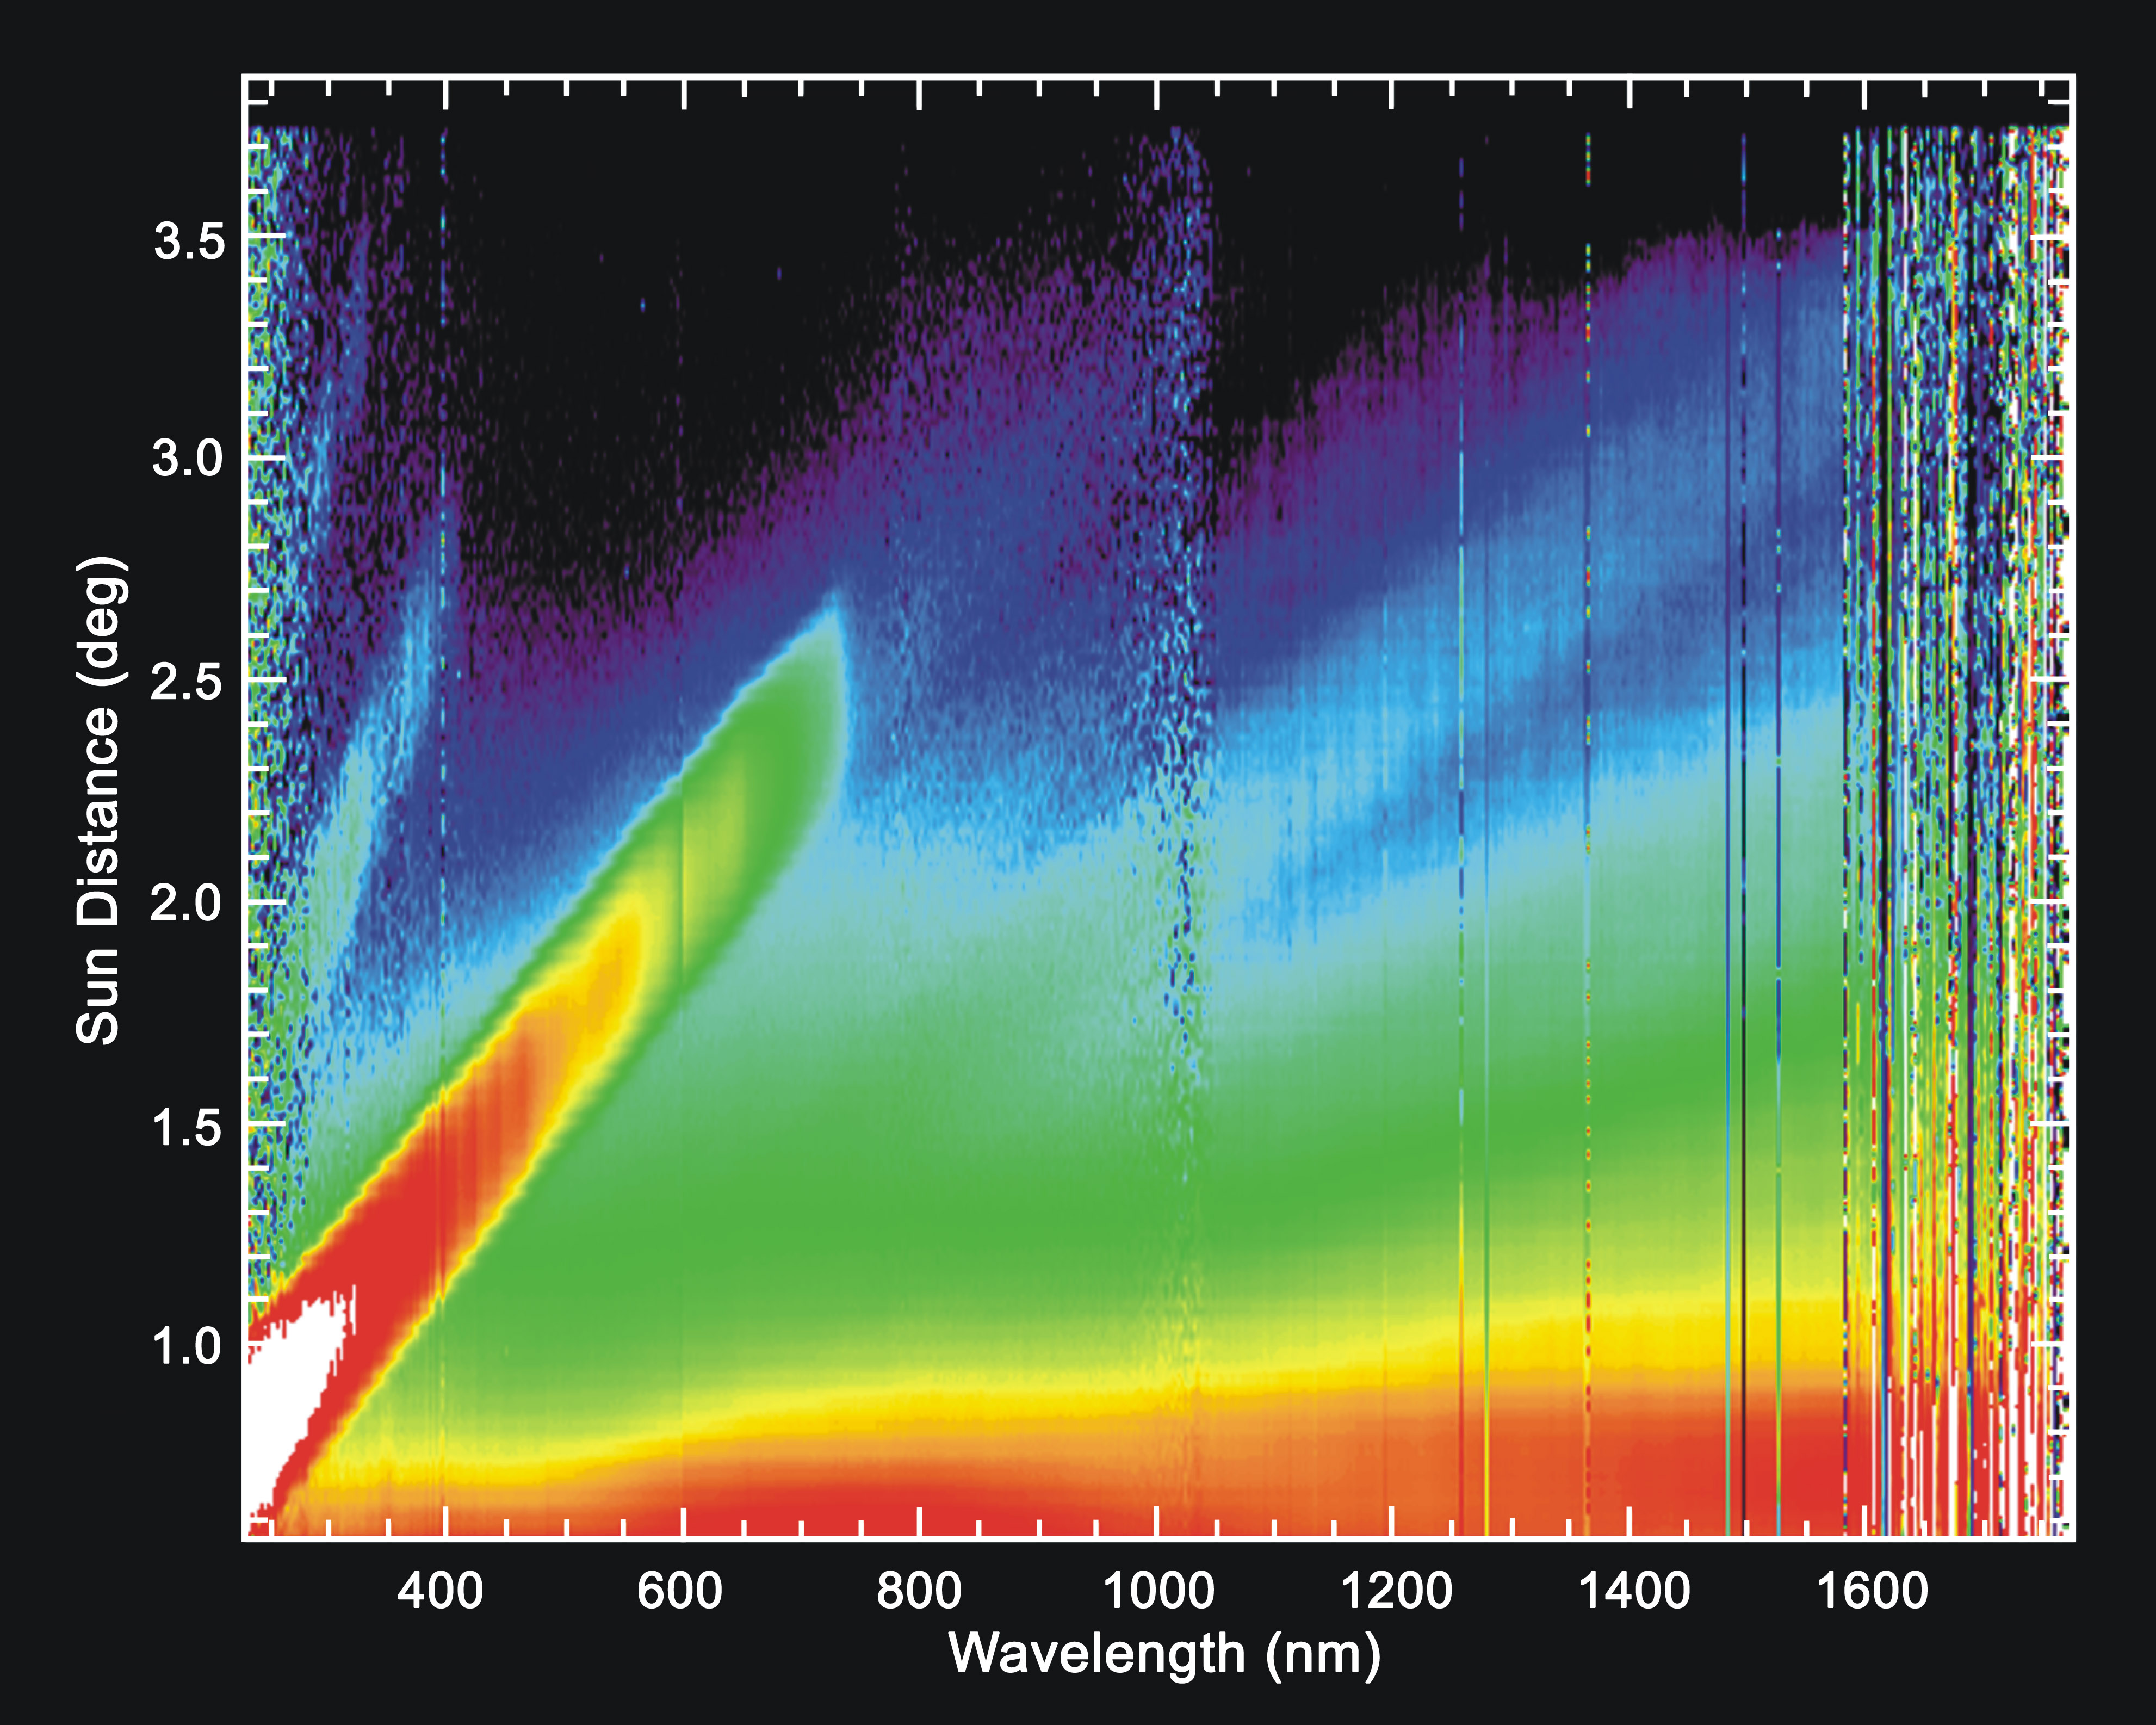
| Fig. 6-11 |
Spatial stray light in channels 1-6 as a function of the LoS distance from the Sun. Close to the
Sun stray light contributions are strongest (red areas). The tilted bands of different strengths are
caused by diffraction from residual grooves in the telescope mirror. The measurements shown here were collected
in close vicinity of the Sun. By varying the distance between Sun and IFoV, characterising the wavelength dependent
diffracted signal was possible. (Courtesy: DLR-IMF) |
 |
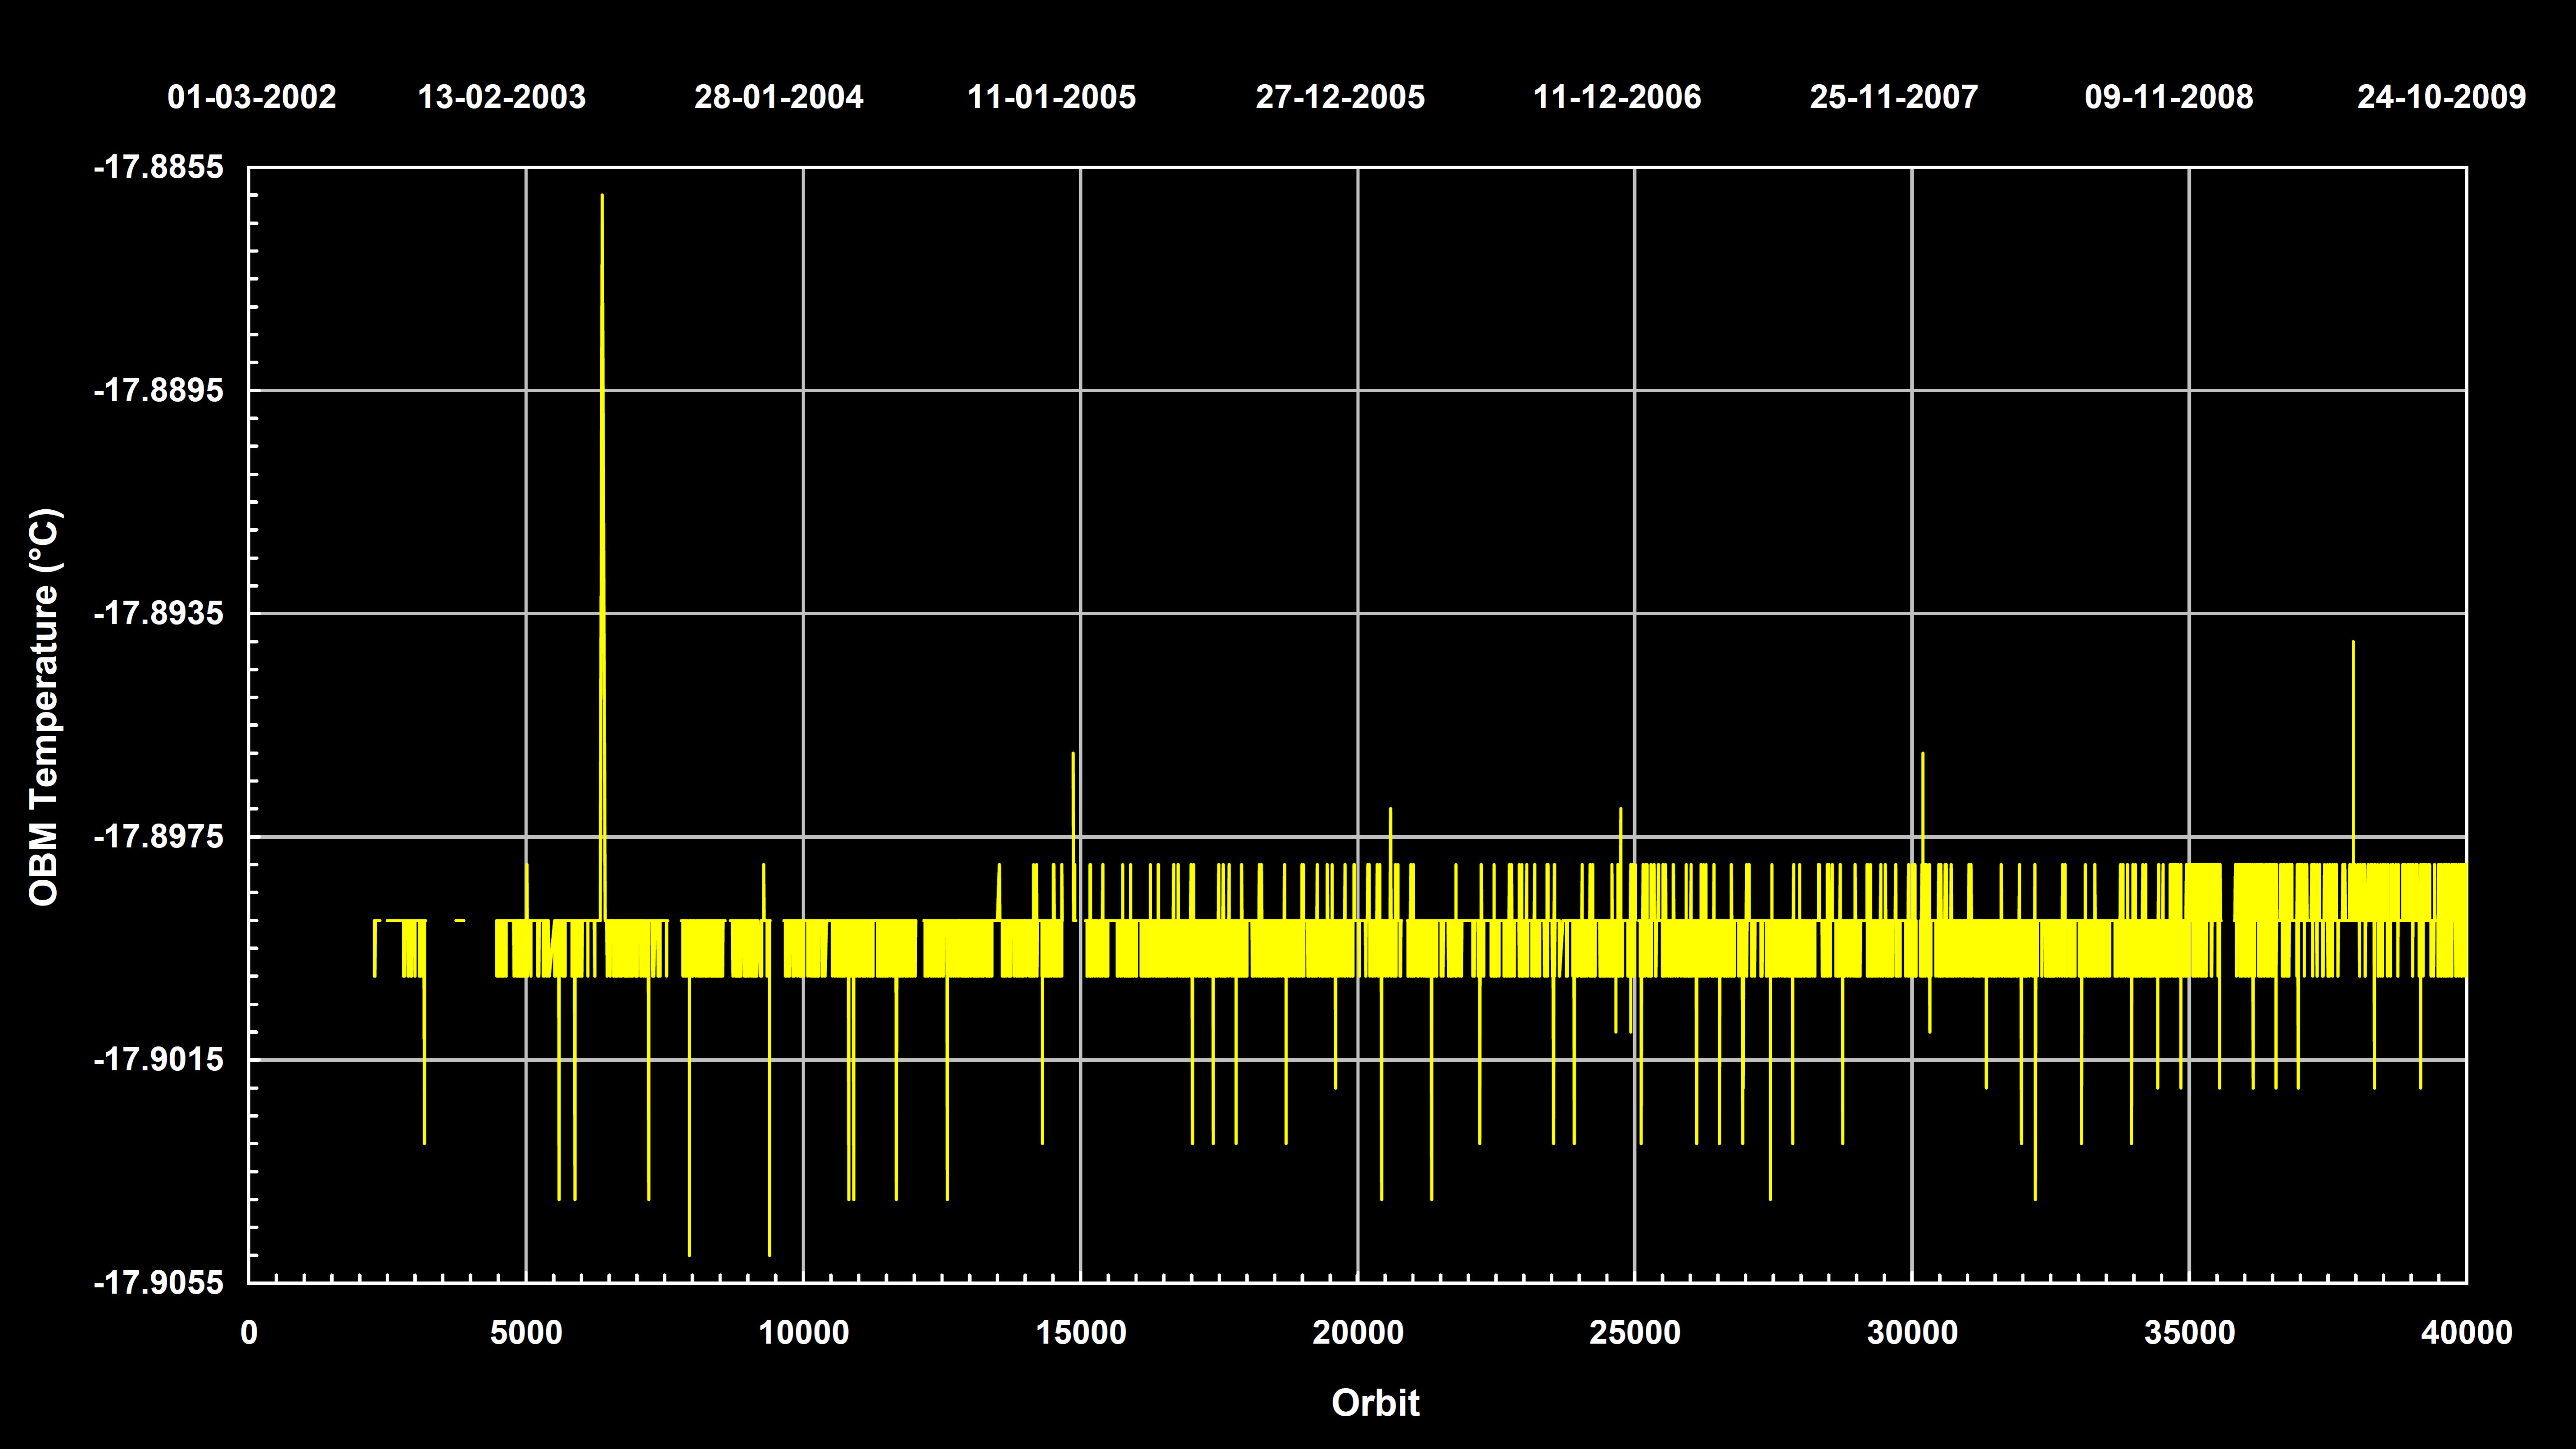
| Fig. 6-12 |
Mean OBM temperature per orbit. On orbit average, the ATC system keeps the OBM within 0.001° C of the
elected temperature. (Courtesy: DLR-IMF) |
 |
| Fig. 6-13 |
Power consumption of the 3 heaters (Nadir, Limb and RAD A) of the ATC system. The curve follows a seasonal
variation with an expected long-term decrease most prominent for the ATC-Nadir heater. The glitch in ATC-Nadir
and ATC-Limb powers in October 2008 is caused by the ATC readjustment. (Courtesy: DLR-IMF) |
 |
| Fig. 6-14 |
Mean detector temperatures per orbit for channels 1-6. Decontamination intervals with elevated temperatures and
periods after instrument saving with too low temperatures are omitted. The resulting curves display the seasonal
variation. Steps are due to TC adjustments, mainly affecting channels 4 and 5. The increase around orbit 5000
corresponds to an overall TC correction to establish new temperature ranges. (Courtesy: DLR-IMF) |
 |
| Fig. 6-15 |
Mean detector temperatures per orbit for the SWIR channels 7 and 8. Displayed data are as in Fig. 6-14.
The graphs are the result of growing ice (increase) and occasional decontaminations (drop to lower values).
Between orbit 10600 and 10900, two TC adjustments had a significant impact on the SWIR detector temperatures.
(Courtesy: DLR-IMF) |
 |
| Fig. 6-16 |
Tangent height offsets as determined from operational data products and TRUE retrieved profile information. Prior to December 2003,
the bias had a strong harmonic variation (red). After the update of the on-board propagator model and including residual platform
mispointing, the variation was reduced but a constant offset persisted (yellow). When the extra mispointing is introduced in
geolocation retrieval this offset vanishes (blue). (Courtesy: IUP-IFE, University of Bremen) |
 |
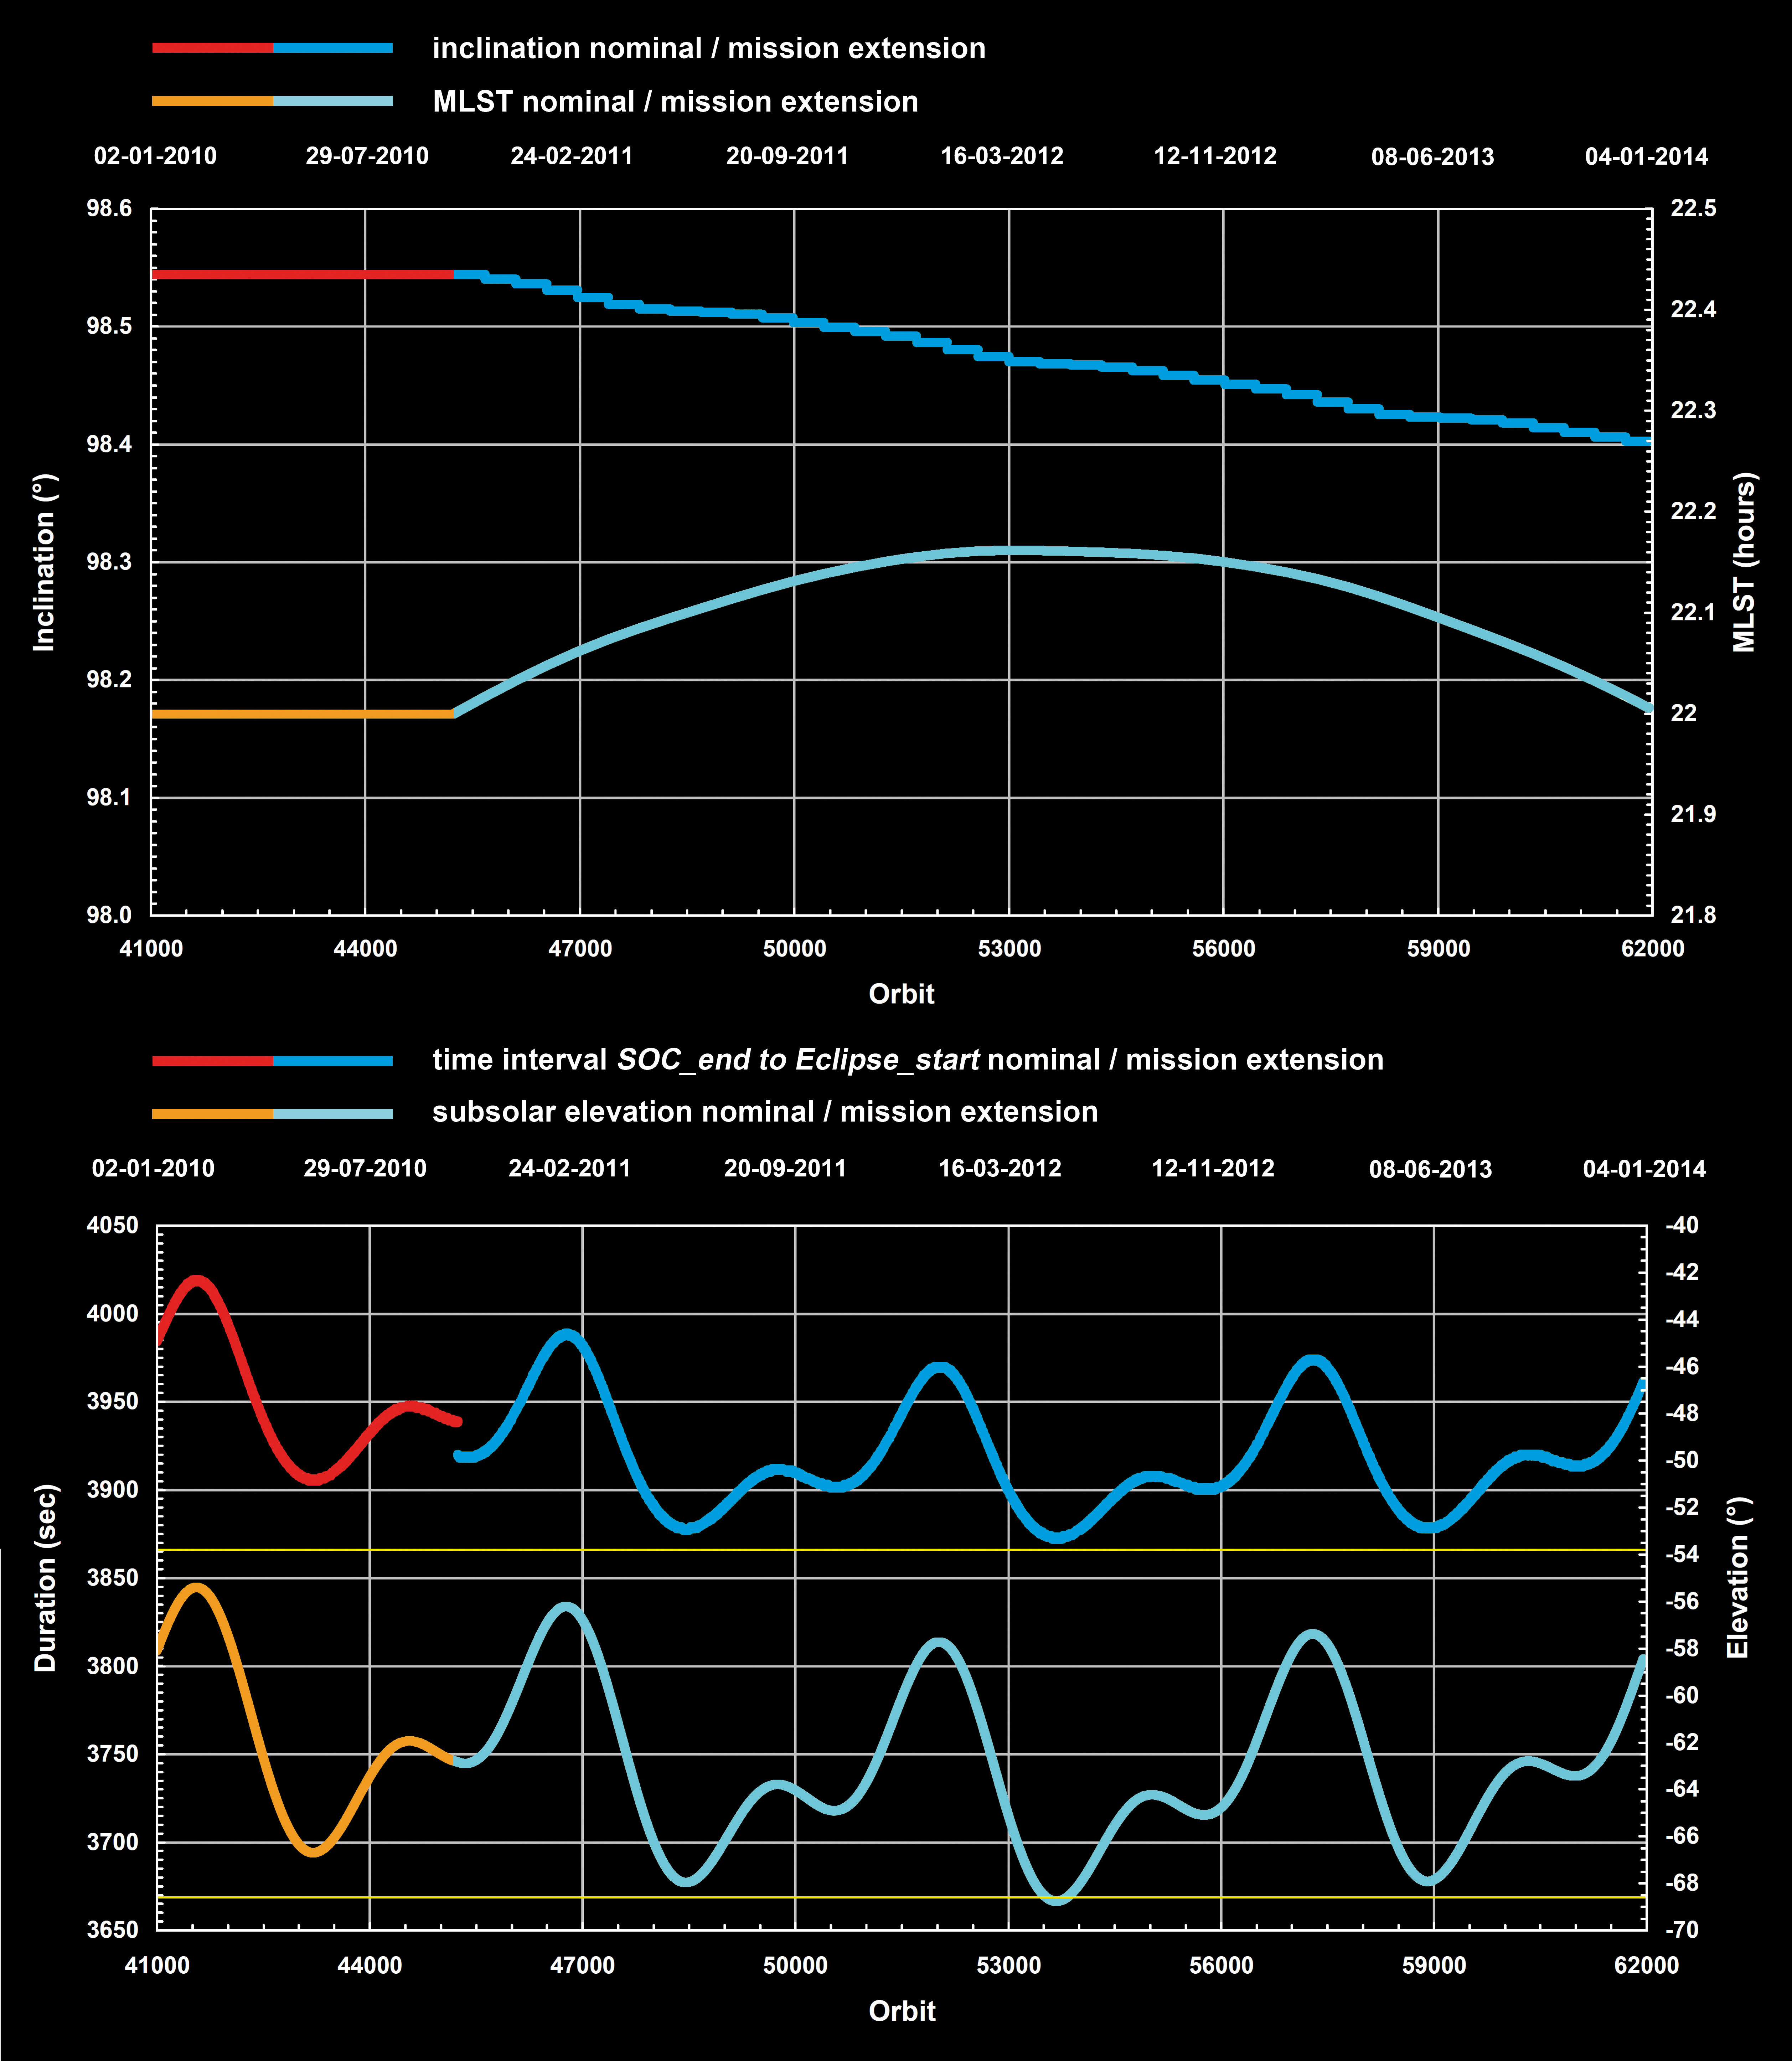
| Fig. 6-17 |
Inclination (left axis) and MLST (right axis) drift of the ENVISAT orbit during the mission extension phase until 2013 (top).
The bottom panel shows an example how the orbit interval from end of the SO&C window to the start of the eclipse (left axis)
and the solar elevation at sub-solar condition (right axis) changes when the orbit altitude is lowered. The yellow lines indicate
the lower and upper limit of the NCWM window. (Courtesy: DLR-IMF) |
 |
Page generated 31 August 2011