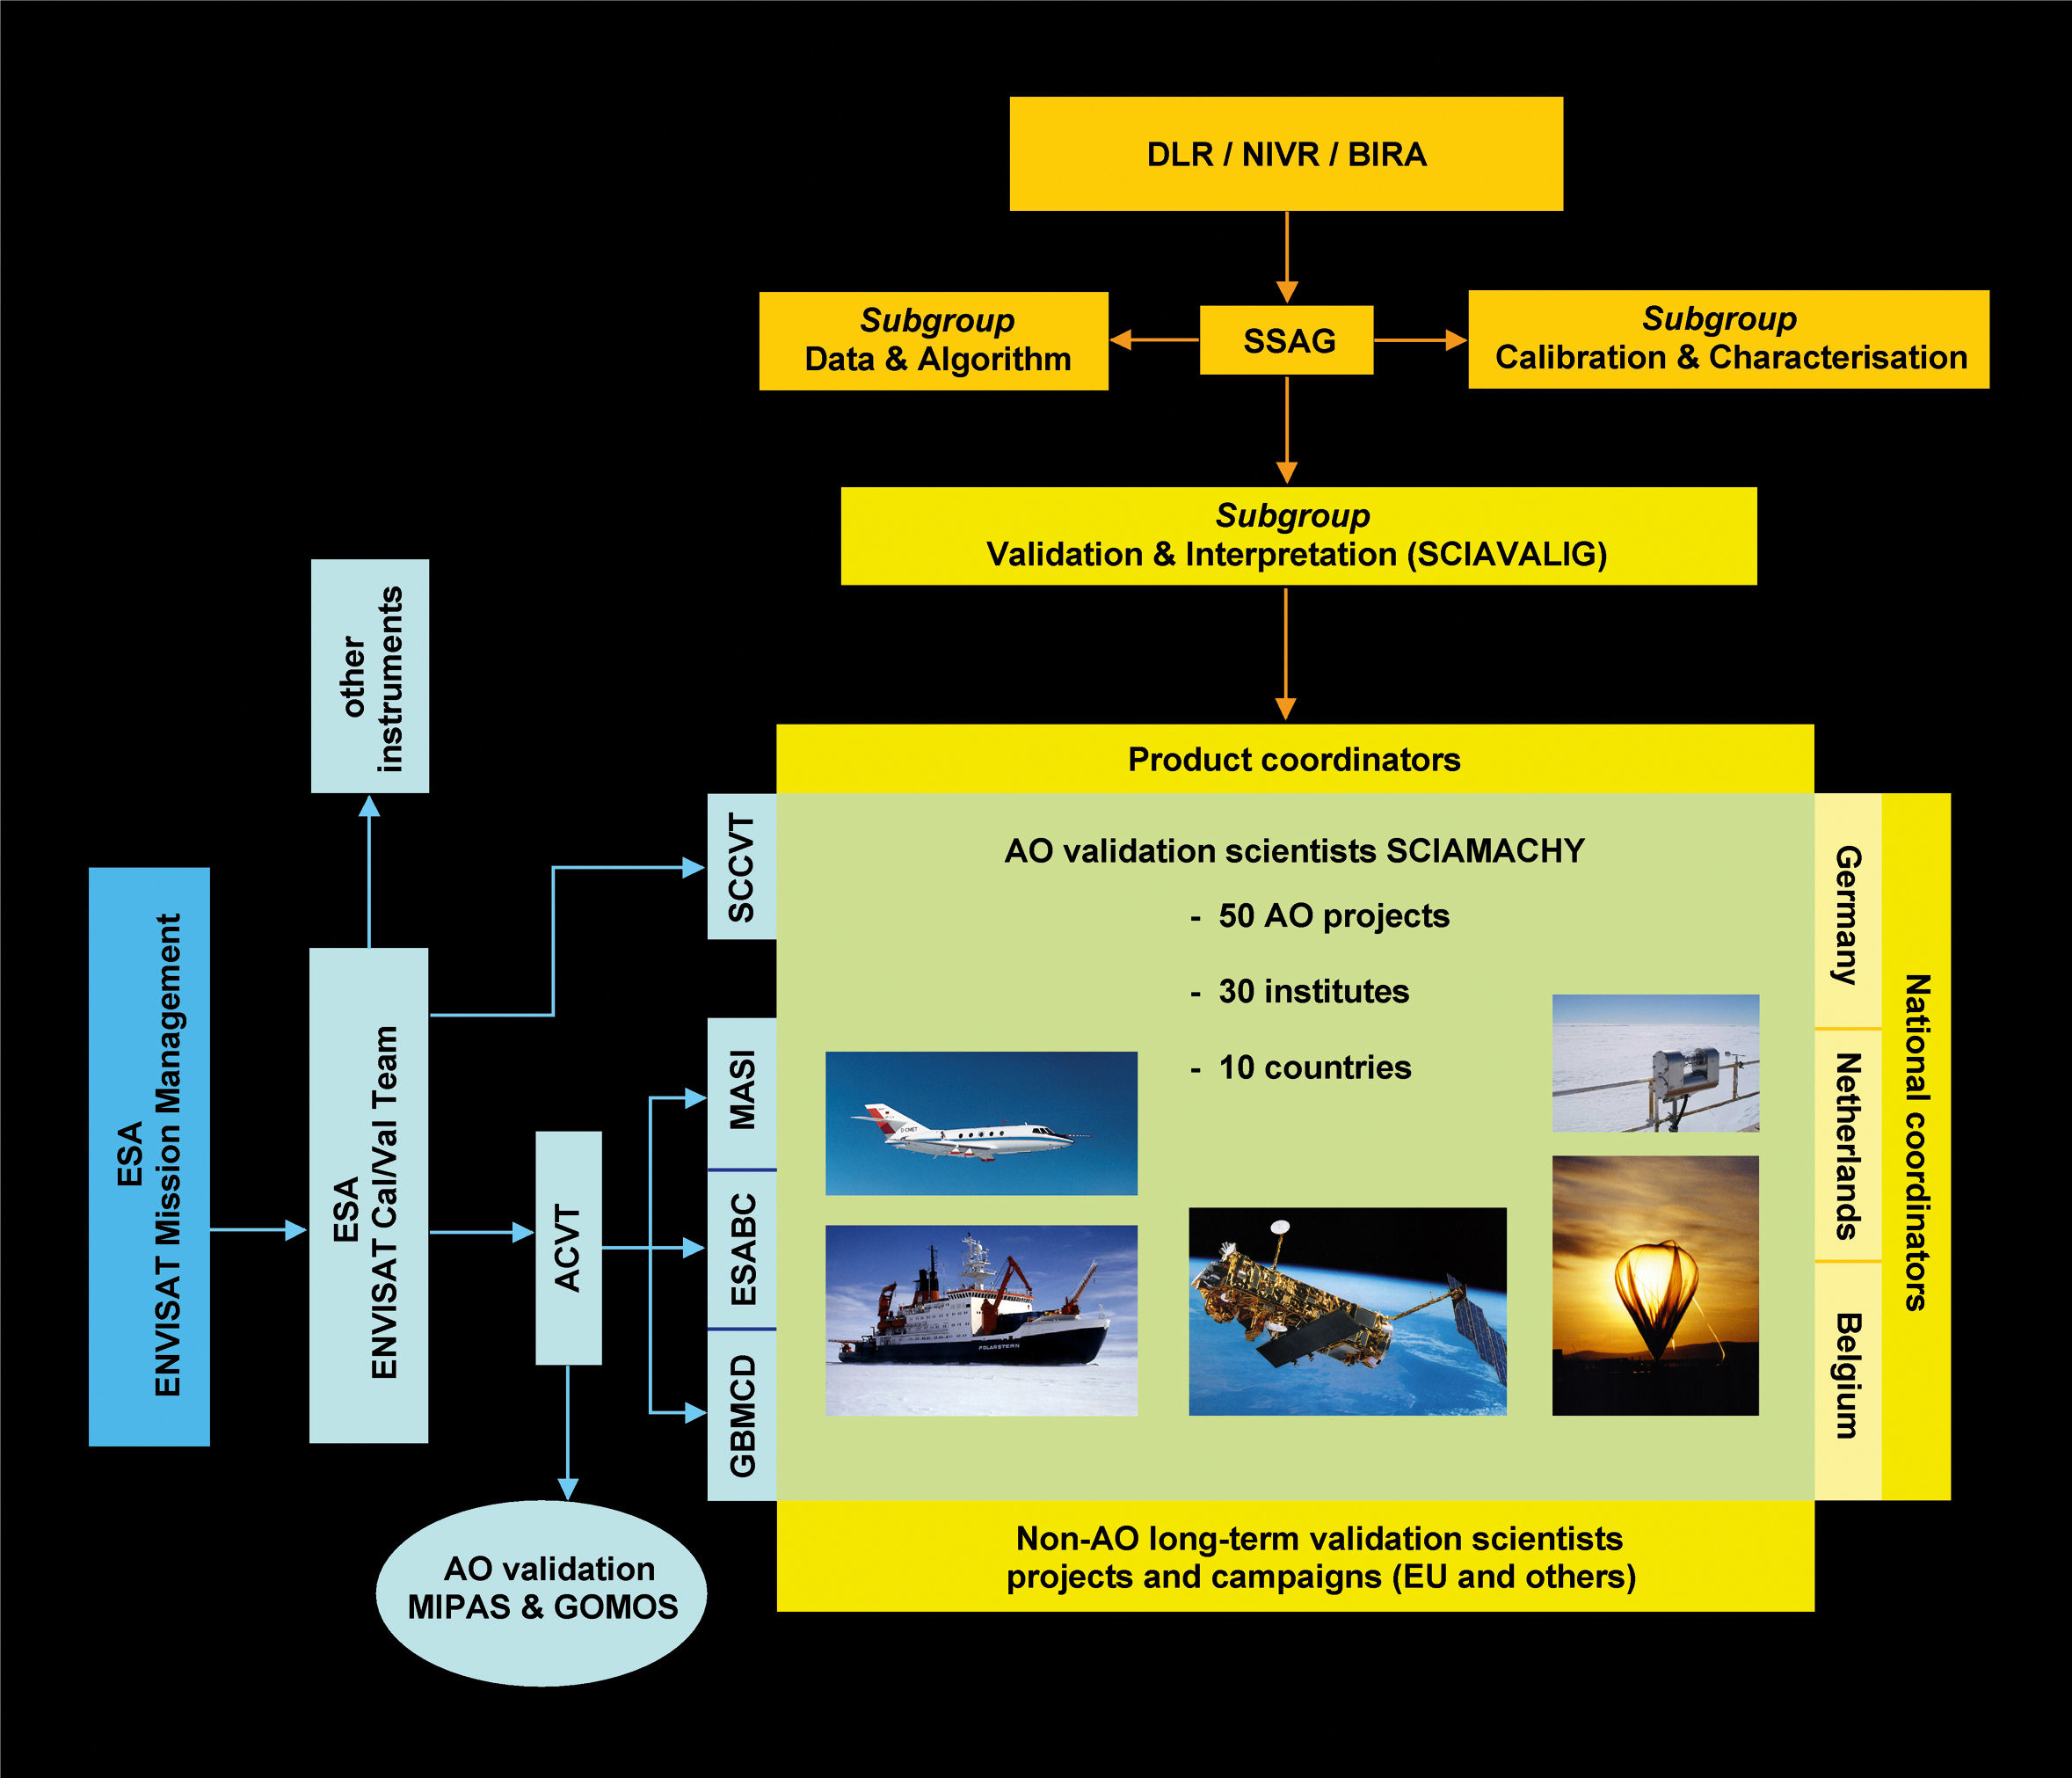
| Fig. 9-1 |
A scheme of the SCIAMACHY
validation organisational structures set-up by SCIAVALIG (light orange)
and by ESA (pale blue). The validation scientists actually doing the work are supported
by both organisations, if they have an approved AO proposal for SCIAMACHY validation (green). (graphics: DLR-IMF and
KNMI) |
|
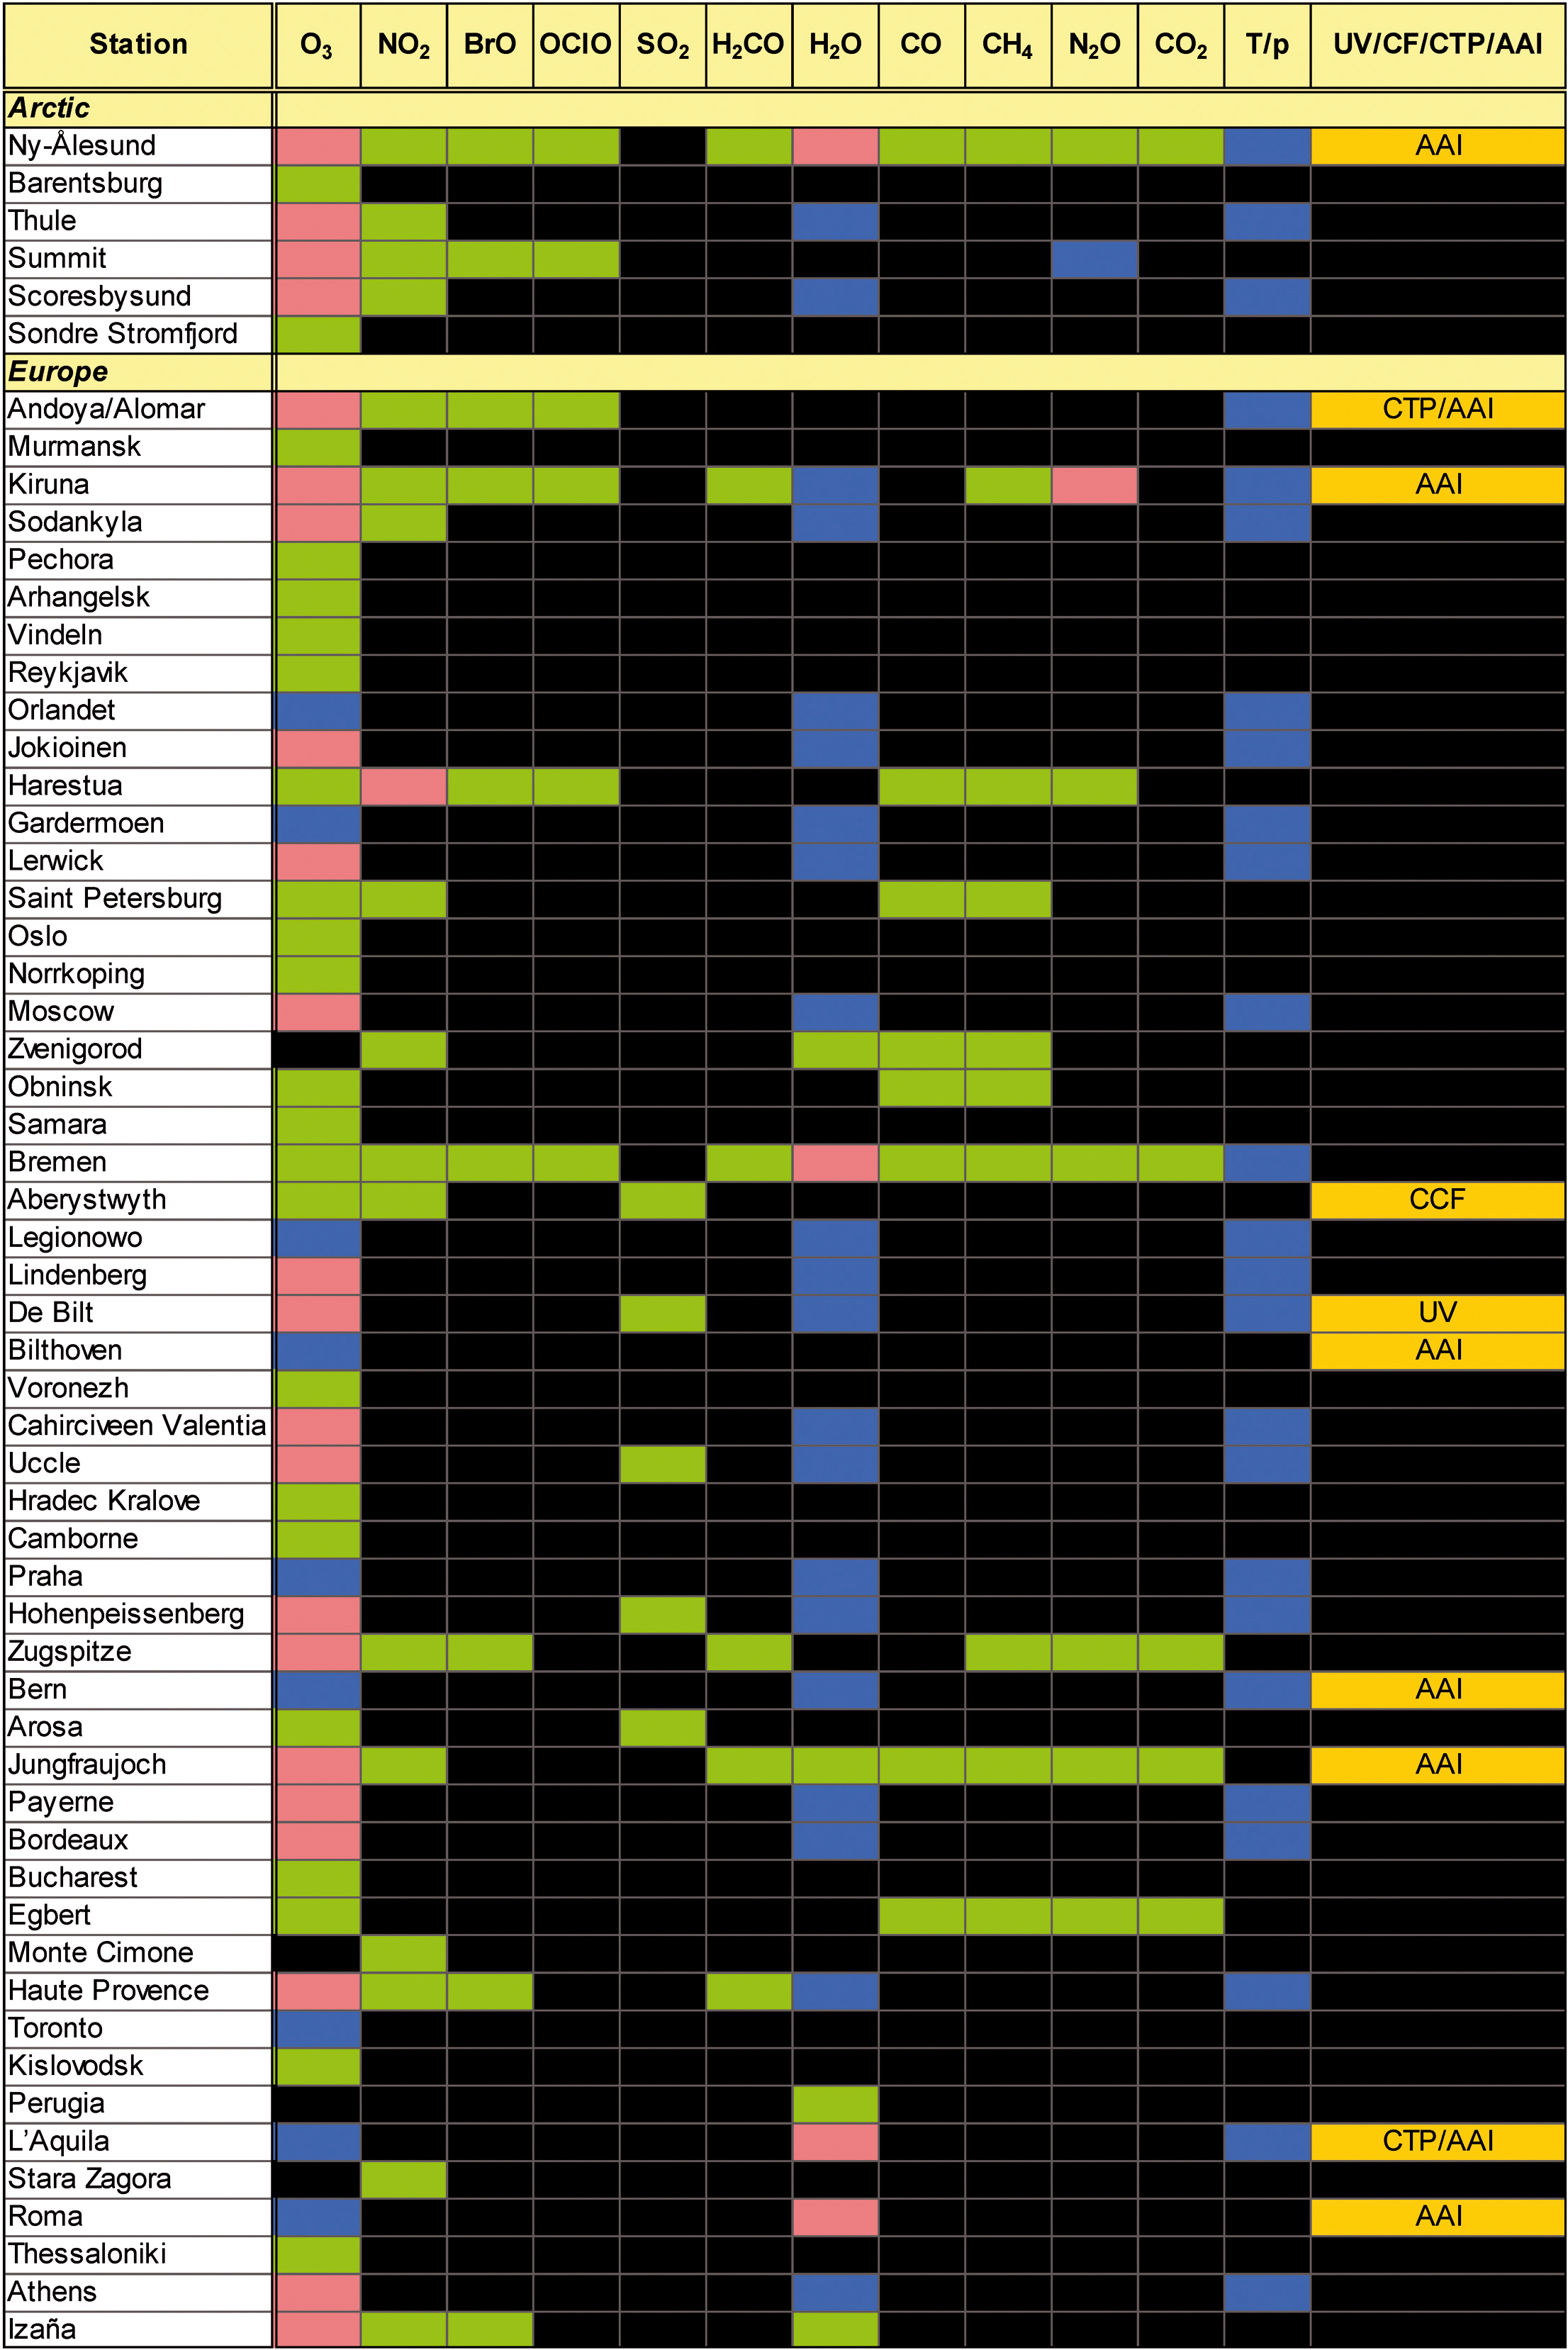
| Fig. 9-2a | Ground-based
stations contributing to SCIAMACHY validation and associated SCIAMACHY data products. The last column includes UV, CF (cloud fraction),
CTP (cloud top pressure) and AAI (absorbing aerosol index). (graphics: KNMI and DLR-IMF) |
|
| Fig. 9-2b | Ground-based
stations contributing to SCIAMACHY validation and associated SCIAMACHY
data products. The last column includes UV, CF (cloud fraction), CTP (cloud top pressure) and AAI (absorbing aerosol index). (graphics: KNMI and DLR-IMF) |

|
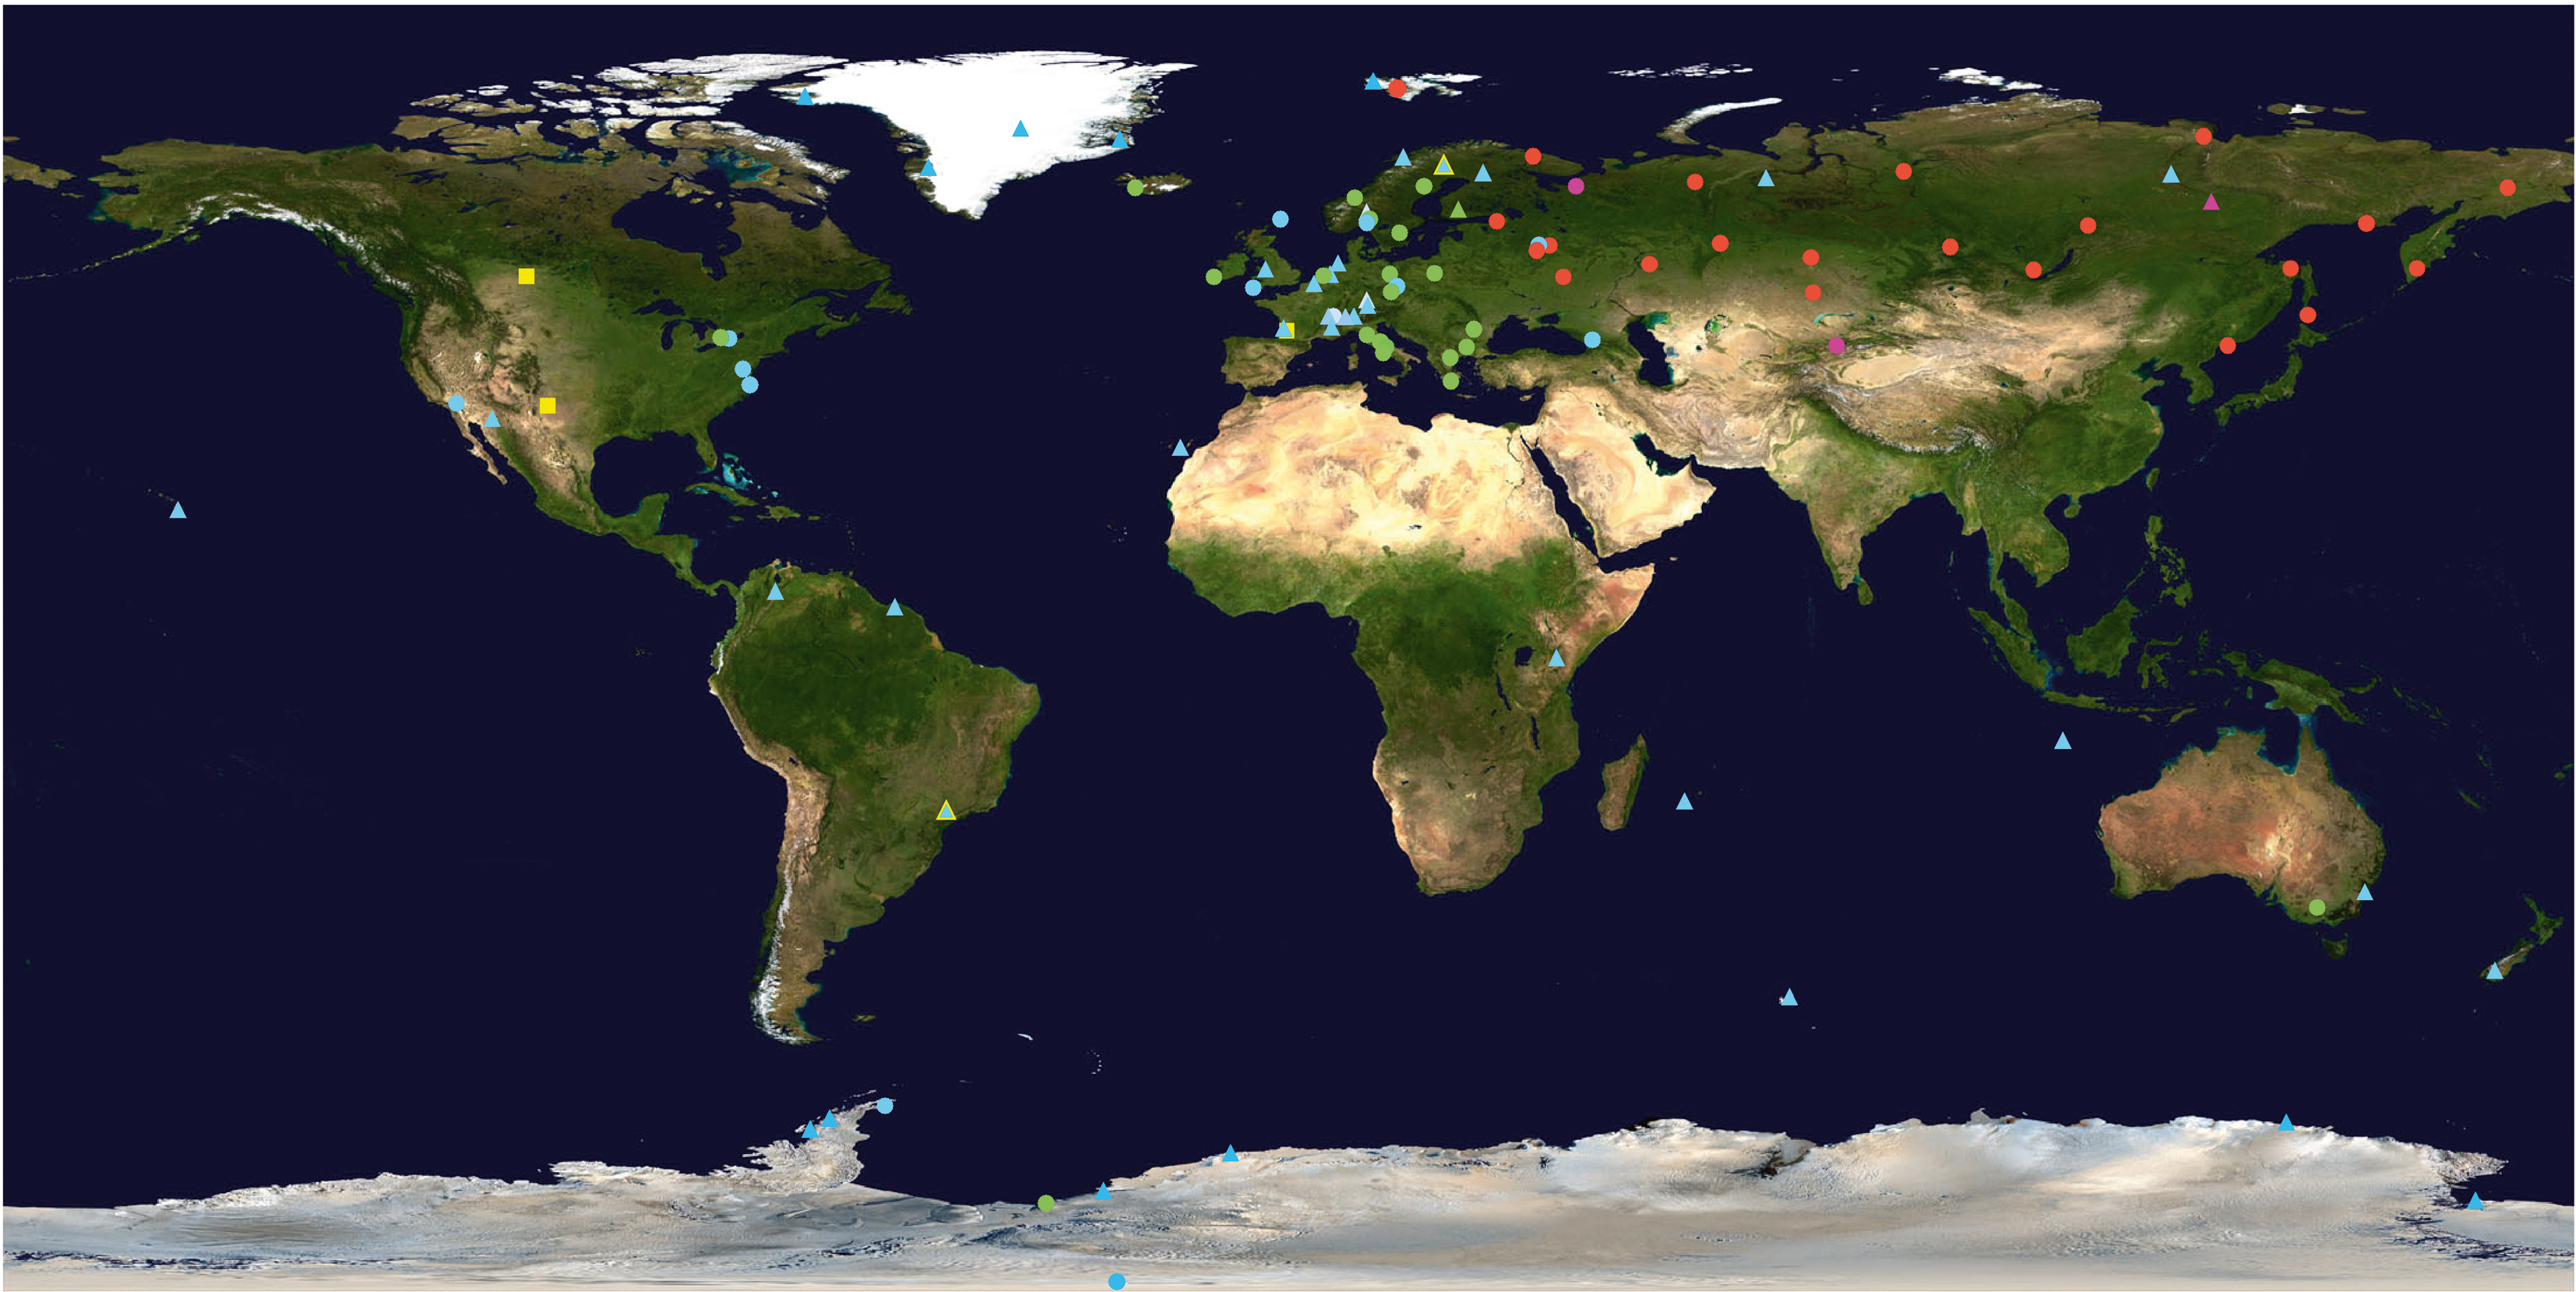
| Fig. 9-3 | Global
distribution of validation sites. Symbols and colour codes are as follows:
triangles = core validation station, blue = NDSC network, red = Russian/NIS M-124 network, purple = NDSC
and Russian/NIS M-124 network, green = no network, yellow square or envelope = balloon launch site. (graphics: DLR-IMF
with Earth map from NASA – Visible Earth) |
|
| Fig. 9-4 |
The
German research vessel Polarstern. (photo: E. Fahrbach) |

|
| Fig. 9-5 | Route
of the Polarstern cruise during the ANT XIX campaign between November 2001 and May 2002. (graphics: DLR-IMF) |

|
| Fig. 9-6 | Falcon
flight tracks for the September 2002 (left) and February/March 2003
(right) SCIA-VALUE airborne campaigns. In red are the northern tracks (September 3-8, 2002 and February 19
– March 3, 2003) while the southern tracks (September 15-28, 2002 and March 10-19, 2003) are displayed in yellow. (graphics: DLR-IMF) |
 |
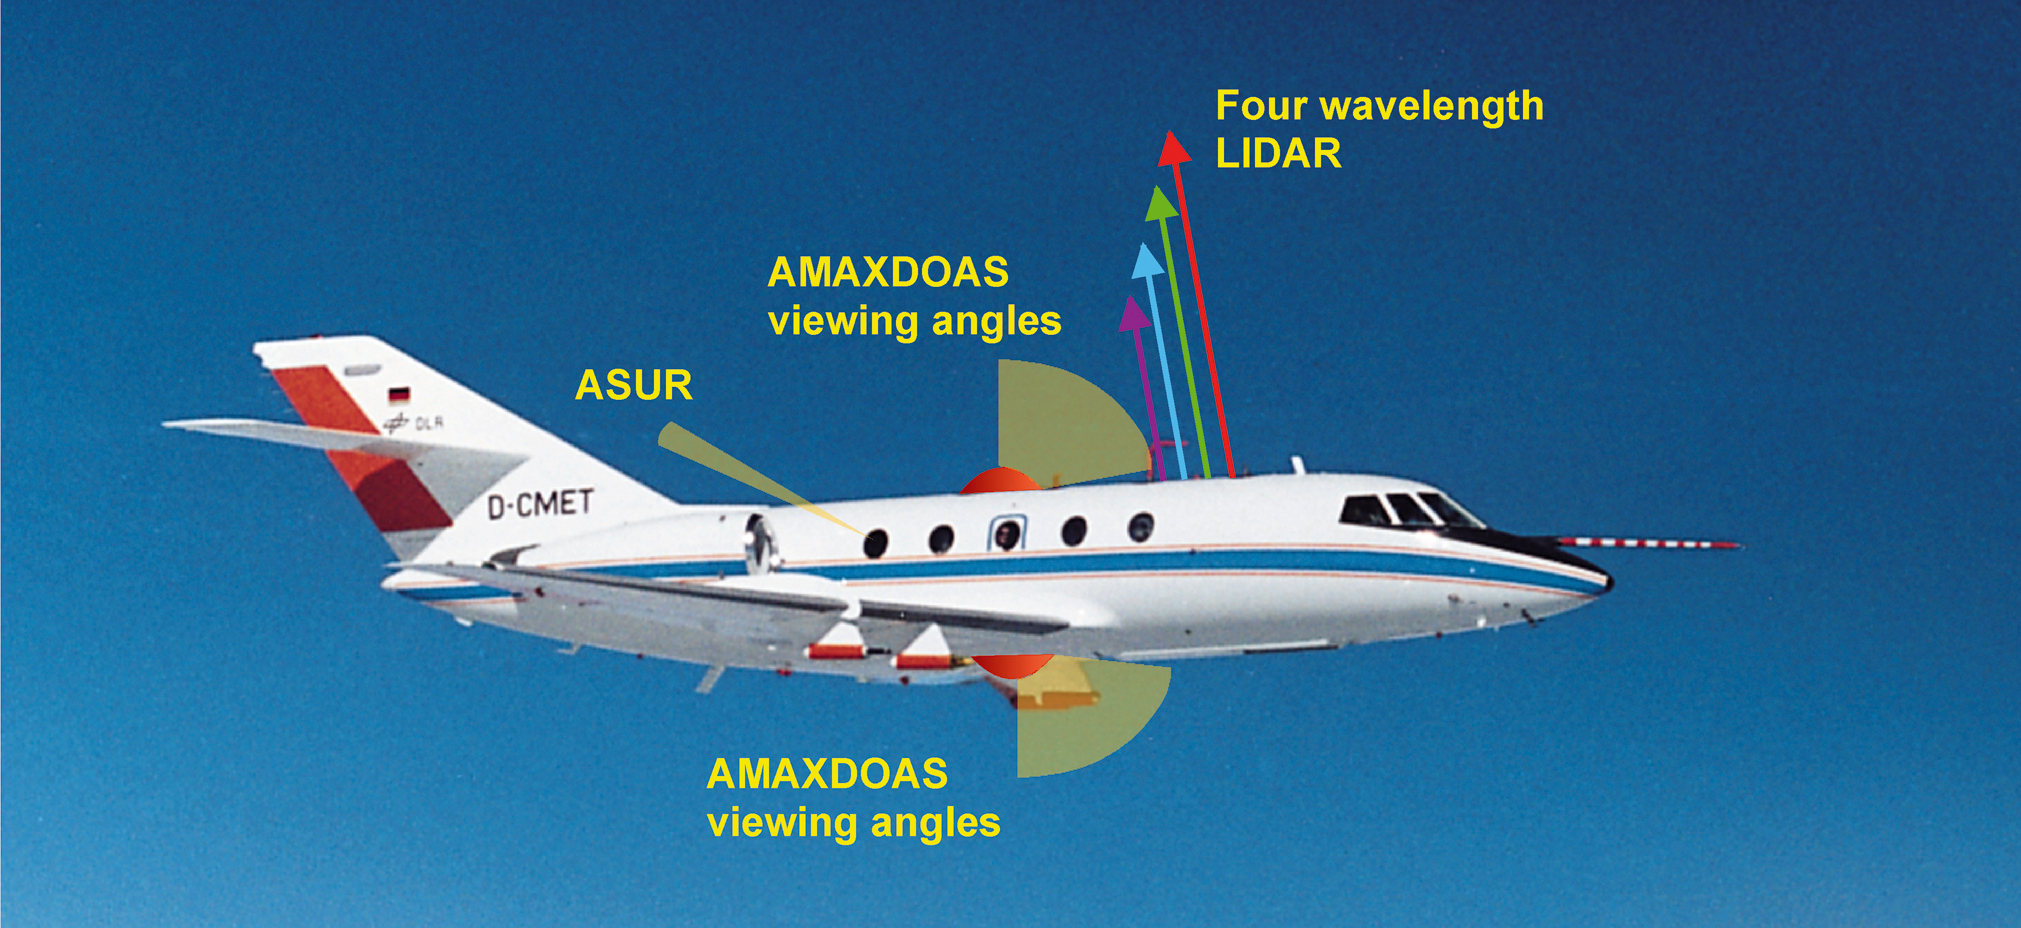
| Fig. 9-7 | The
Falcon aircraft with the viewing directions of the validation instruments. (image: Fix et al. 2005) |
|
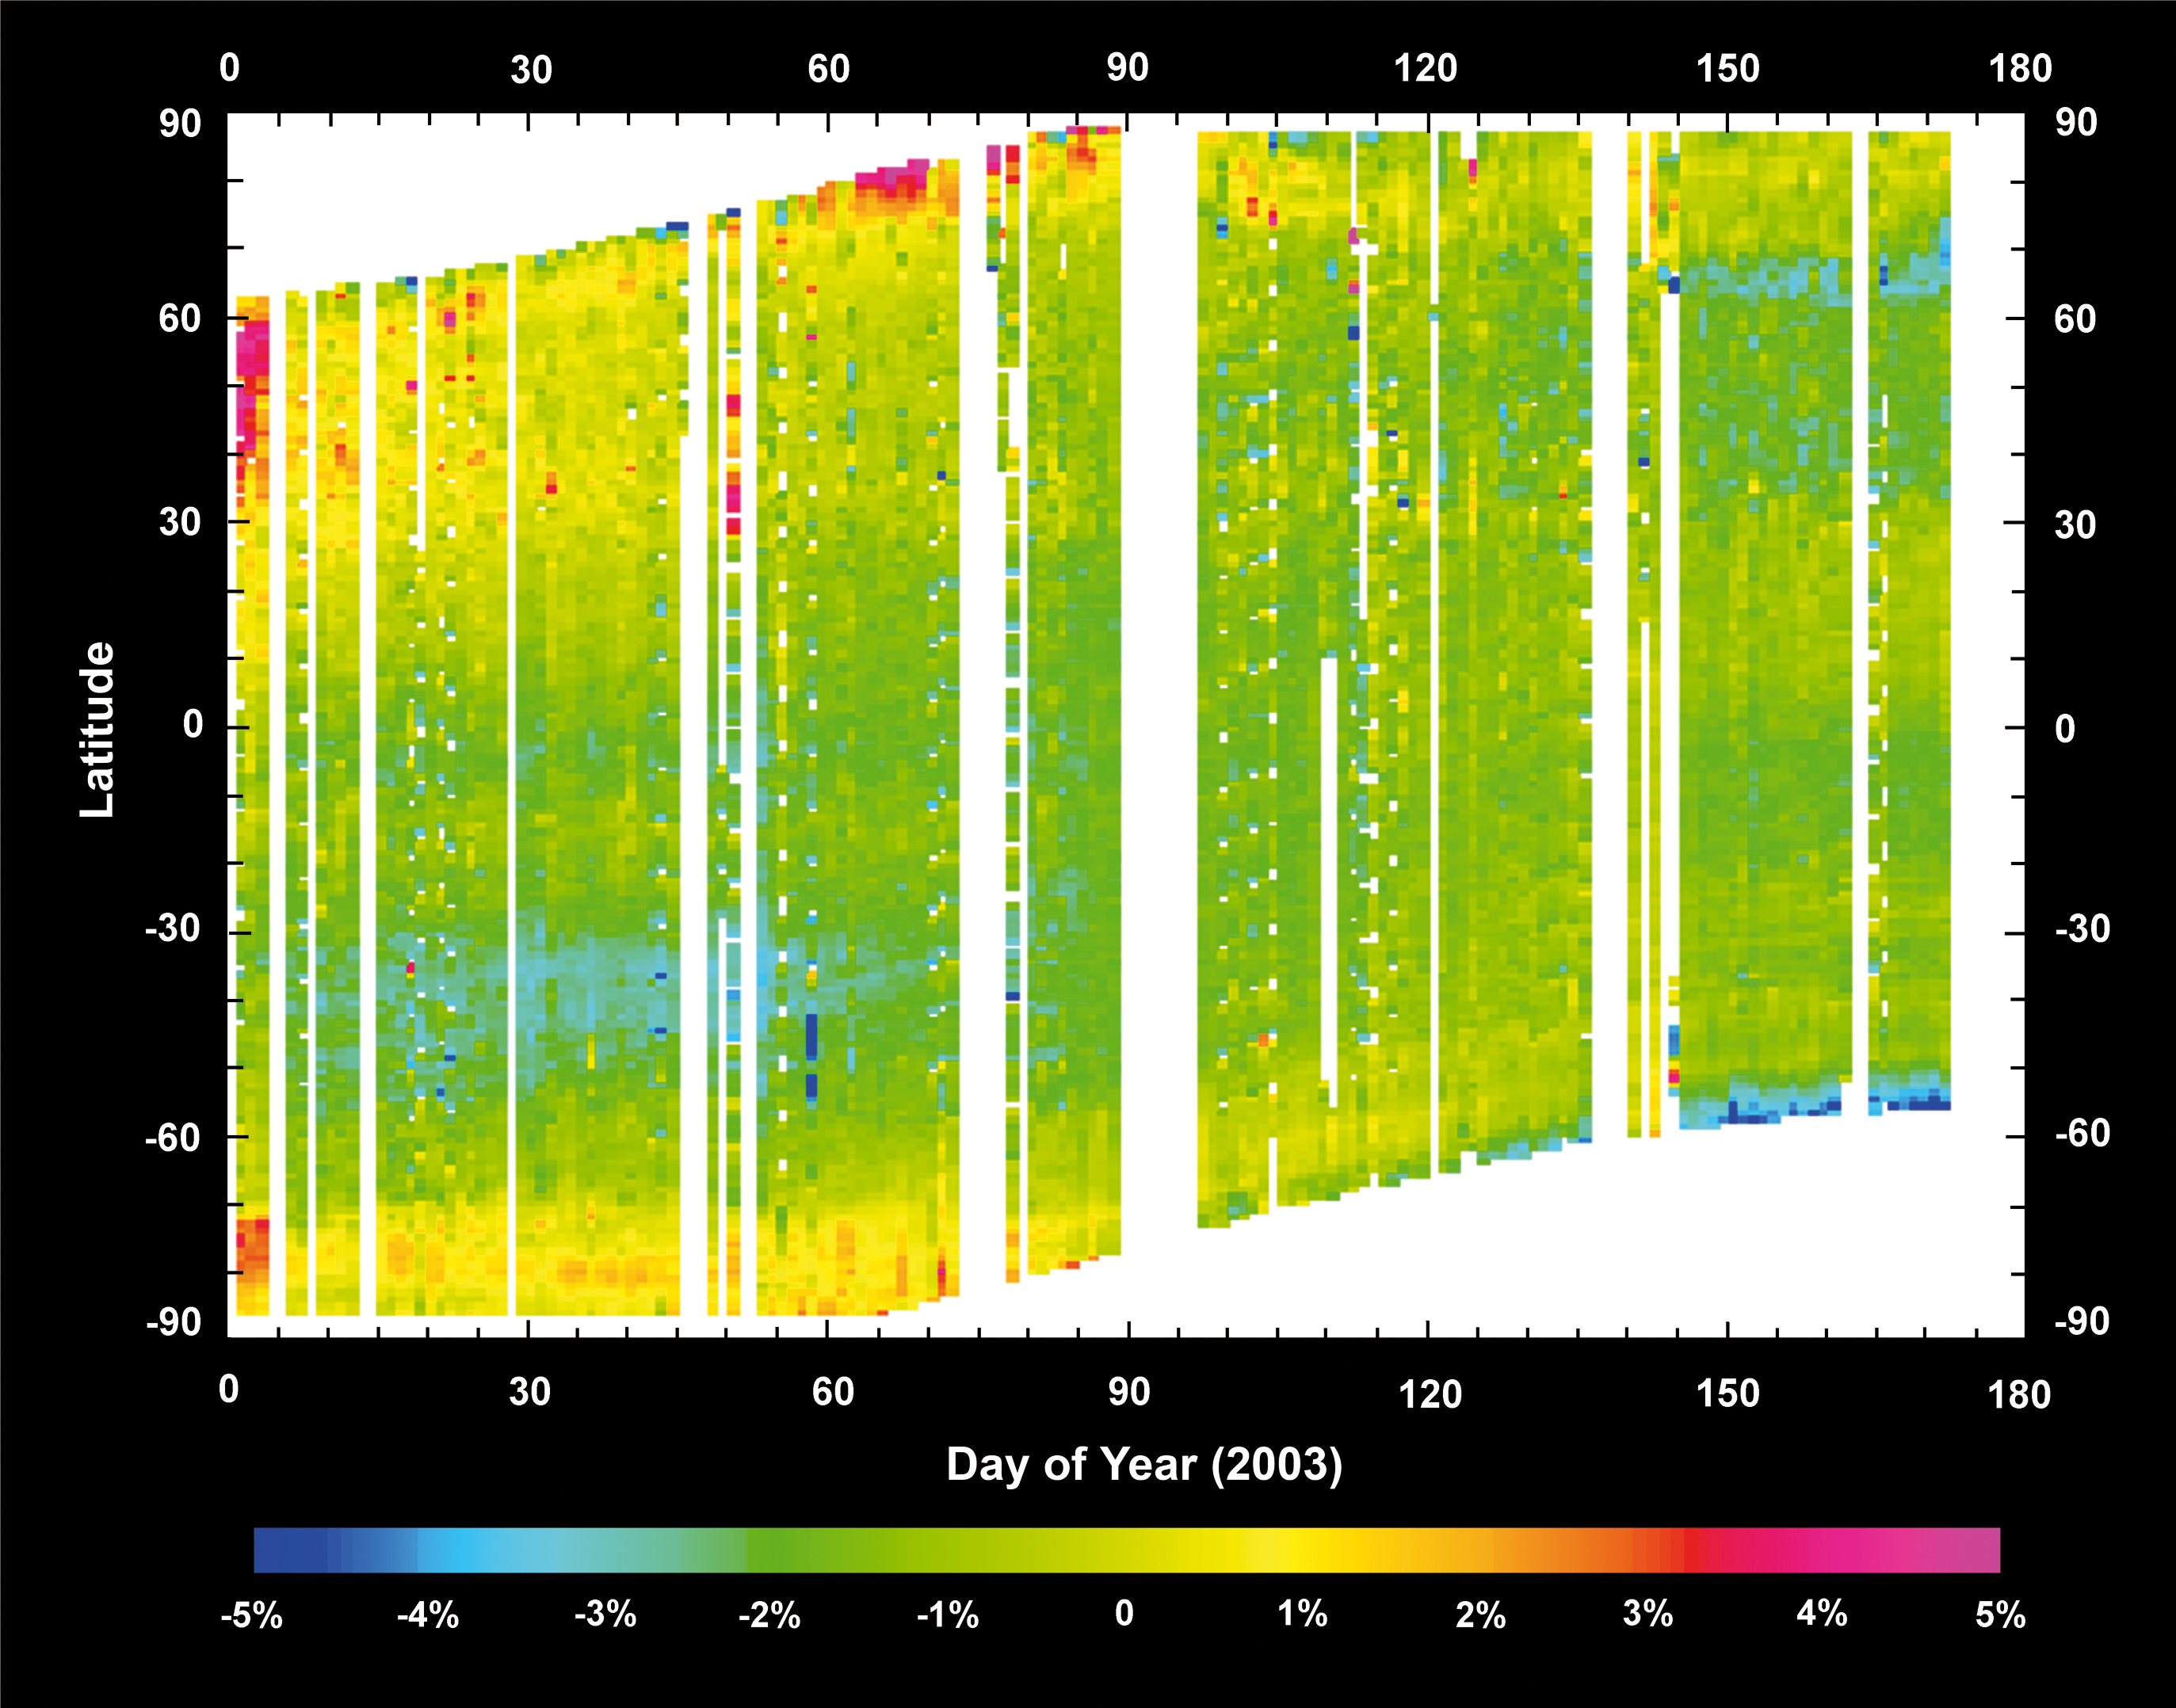
| Fig. 9-8 | Difference
between the ozone columns retrieved from SCIAMACHY and from GOME with the same scientific algorithms.
The relative differences are displayed in colour, as a function of the
day since January 1st, 2003 (horizontal axis) and the latitude (vertical axis). Data is presented with a latitude resolution
of 1 degree and time resolution of 1 day. The colour scale represents the ratio (SCIAMACHY-GOME)/GOME in %. The SCIAMACHY
O3 columns are retrieved by KNMI. (image: H. Eskes, KNMI) |
|
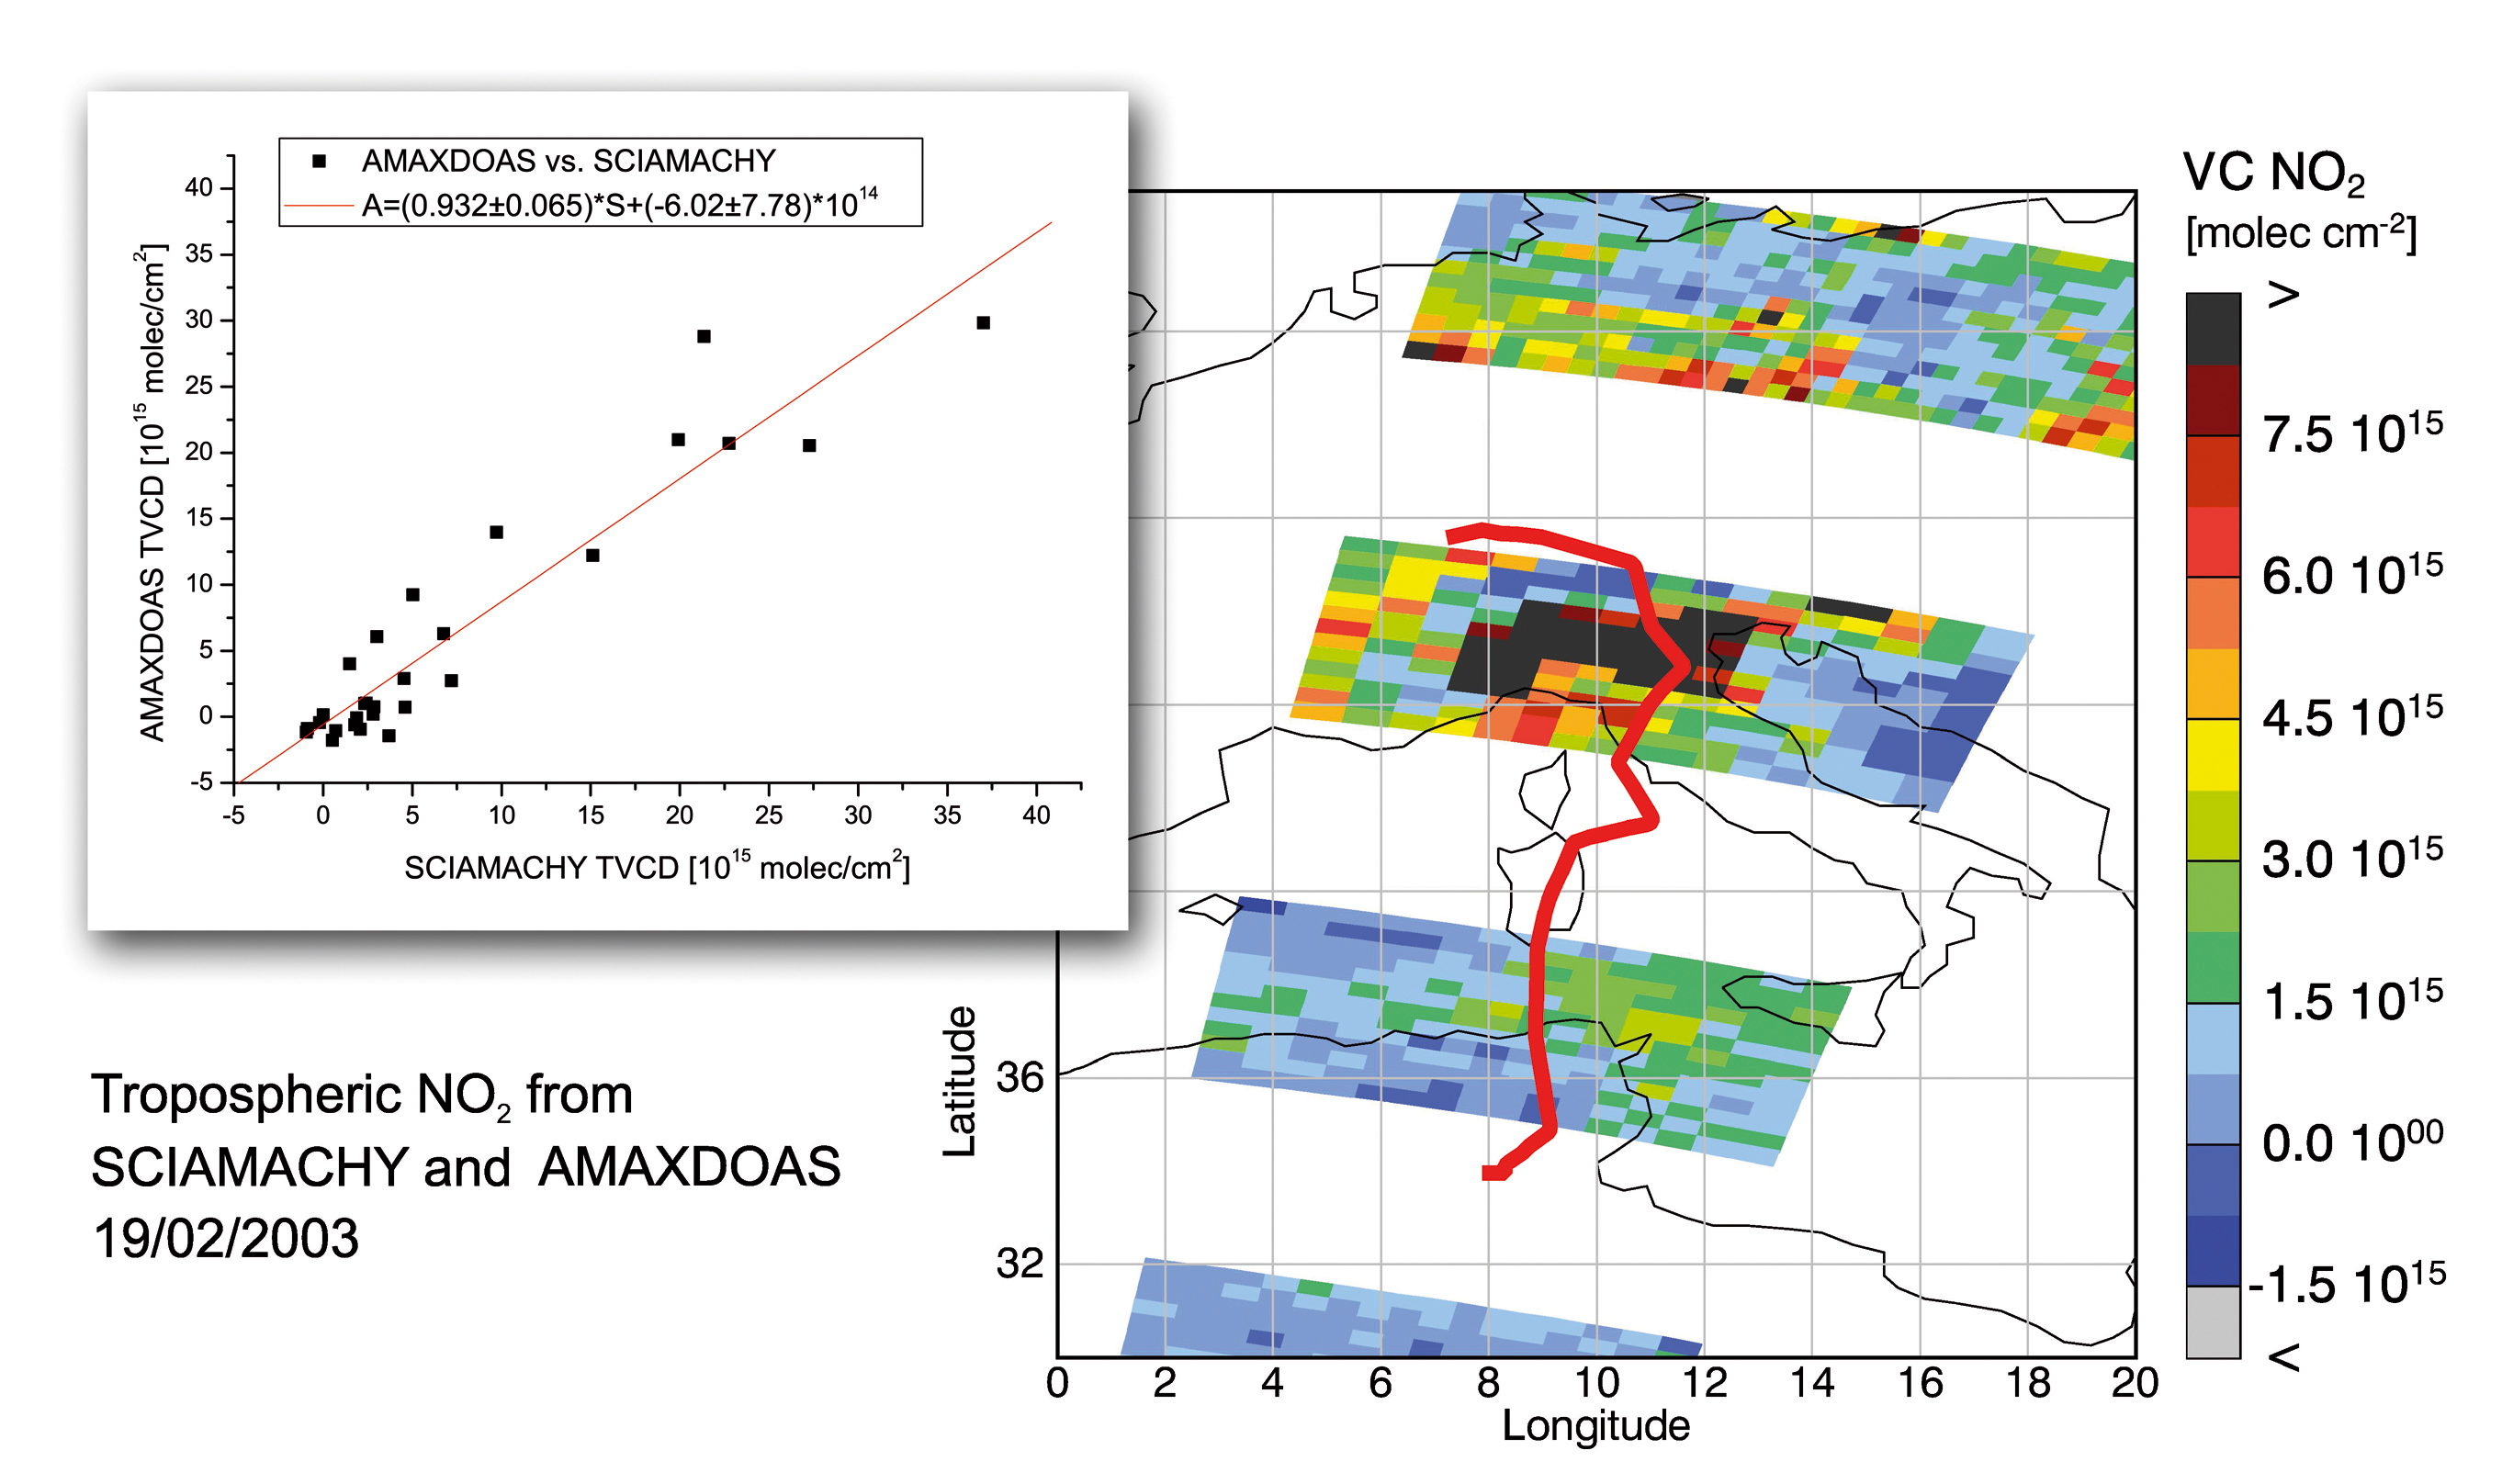
| Fig. 9-9 | Tropospheric
NO2 column obtained by SCIAMACHY together with the Falcon flight track
in red showing where AMAX-DOAS measured almost simultaneously. In the inset tropospheric
NO2 columns from AMAX-DOAS are plotted versus those from SCIAMACHY. The SCIAMACHY tropospheric NO2 columns are retrieved
by IUP-IFE, University of Bremen. (image: Heue et al. 2005) |
 |
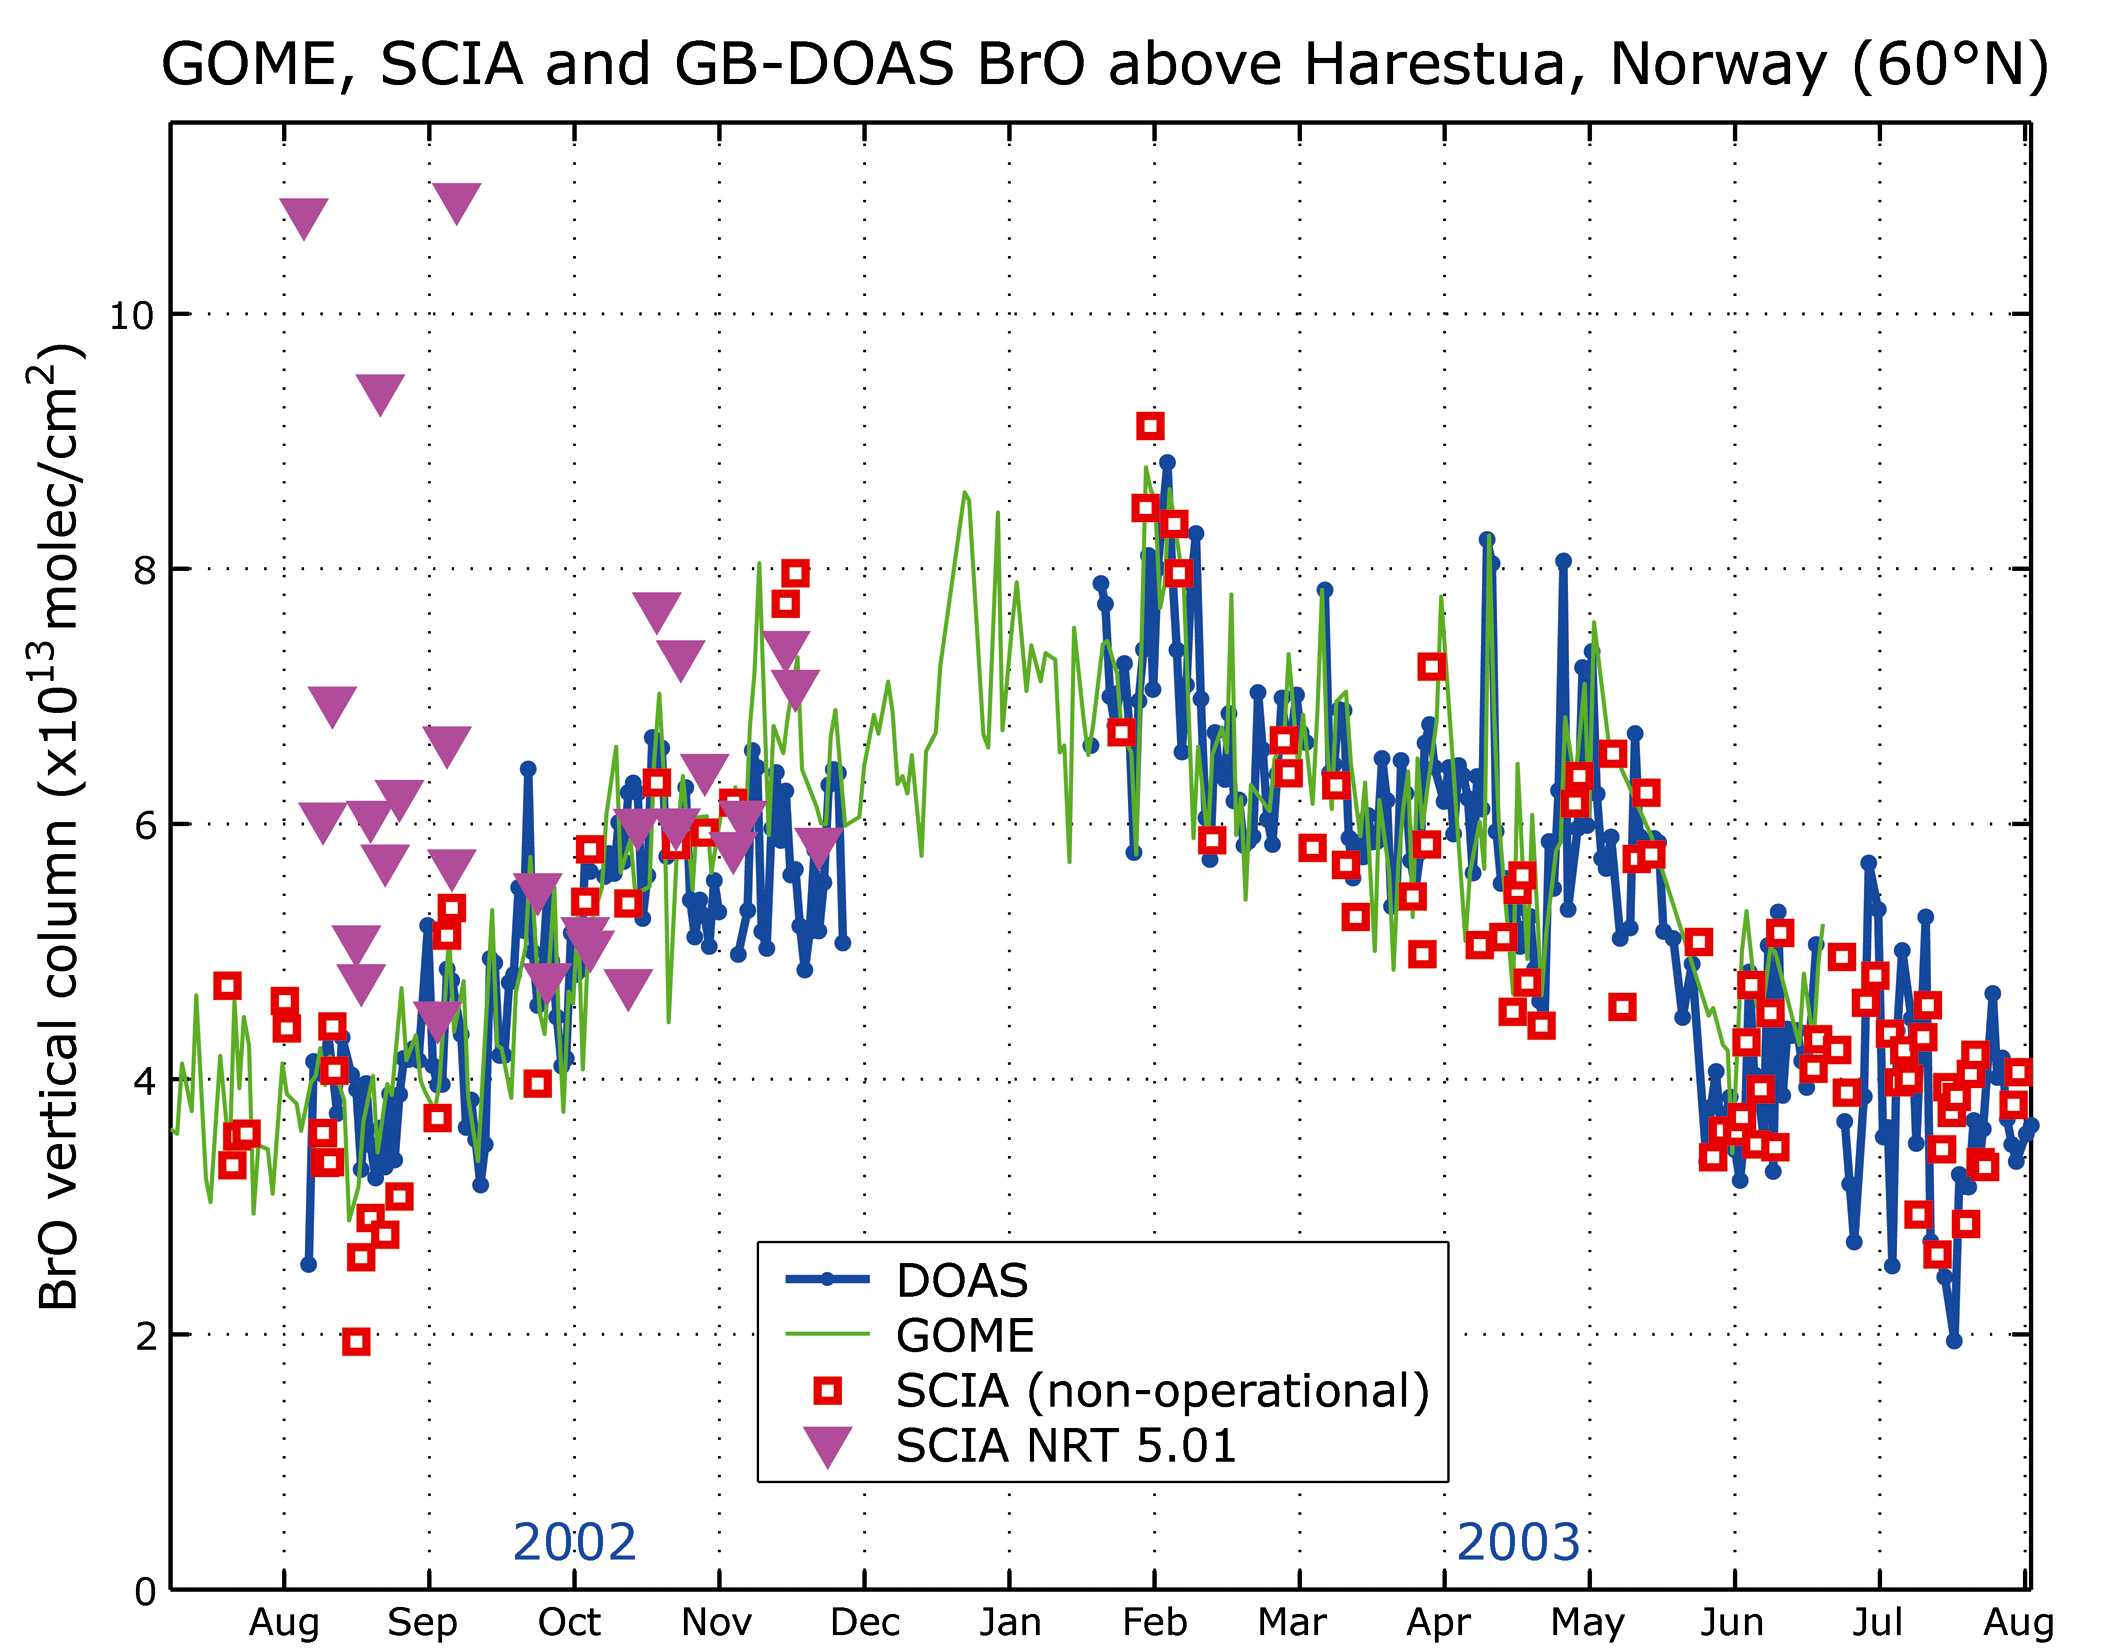
| Fig. 9-10 | Intercomparison
of BrO vertical columns retrieved from GOME, SCIAMACHY and ground-based DOAS measurements at Harestua, Norway, 60°N, 10°E.
SCIAMACHY data products from the ESA NRT processor version 5.01 are shown together with scientific retrievals performed at BIRA-IASB. Airmass
factors used to convert slant columns to vertical columns are calculated using same atmospheric profiles in all cases. (image:
Van Roozendael et al. 2004) |
 |
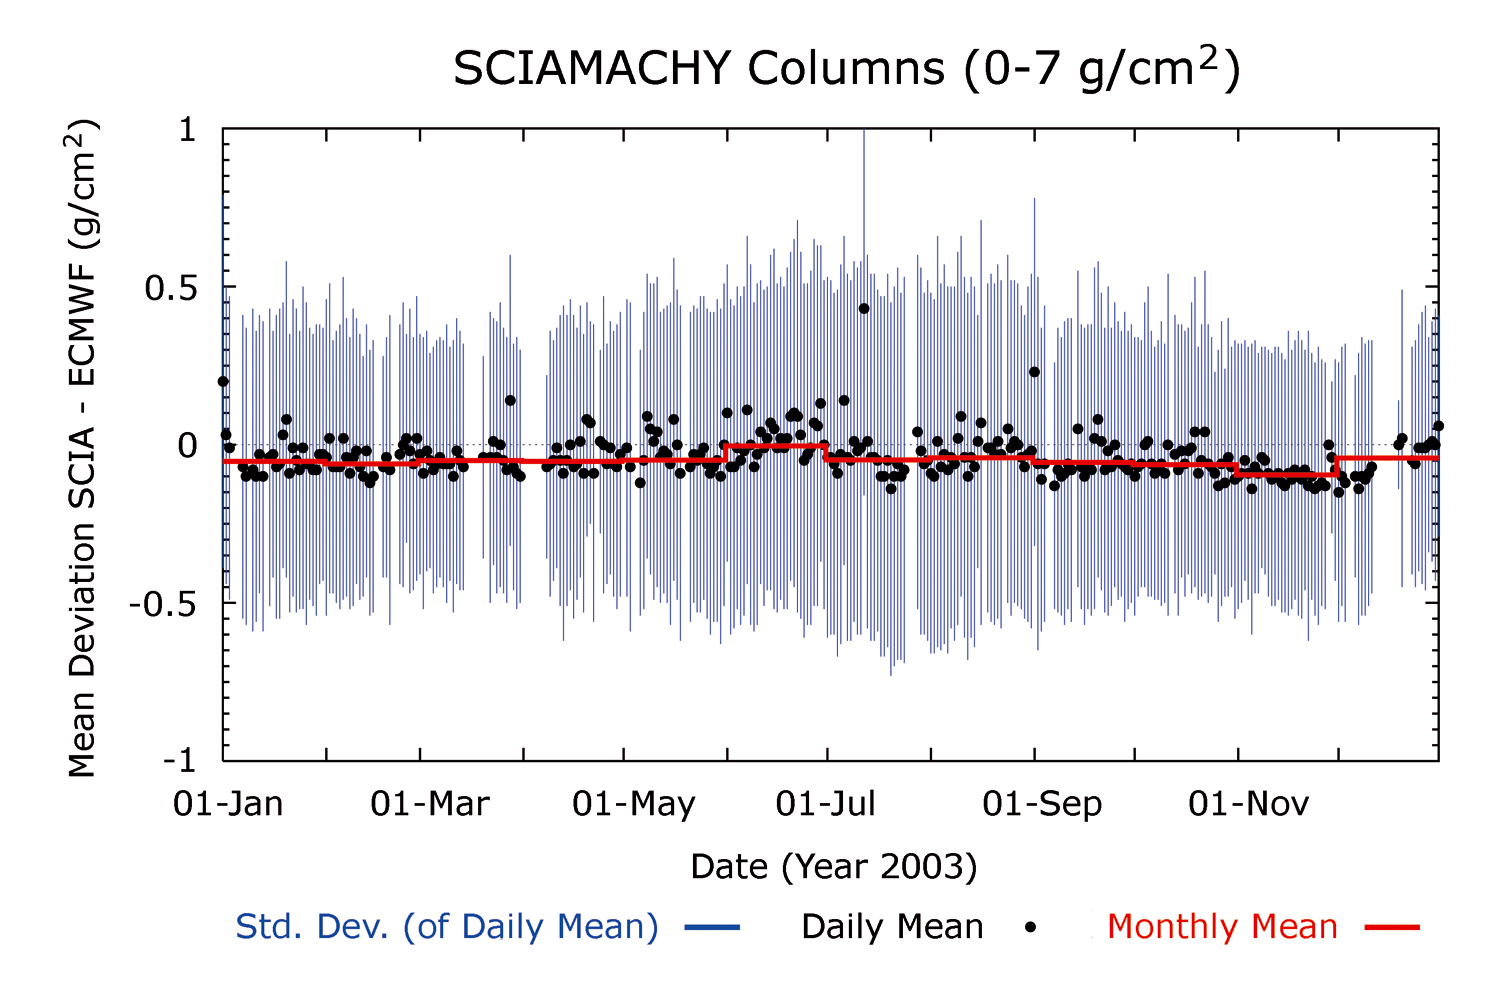
| Fig. 9-11 | Global
mean and standard deviation of the difference between collocated SCIAMACHY
and ECMWF water vapour columns for the year 2003. The SCIAMACHY H2O columns are retrieved by
IUP-IFE, University of Bremen. (image: Noël et al. 2005) |
|
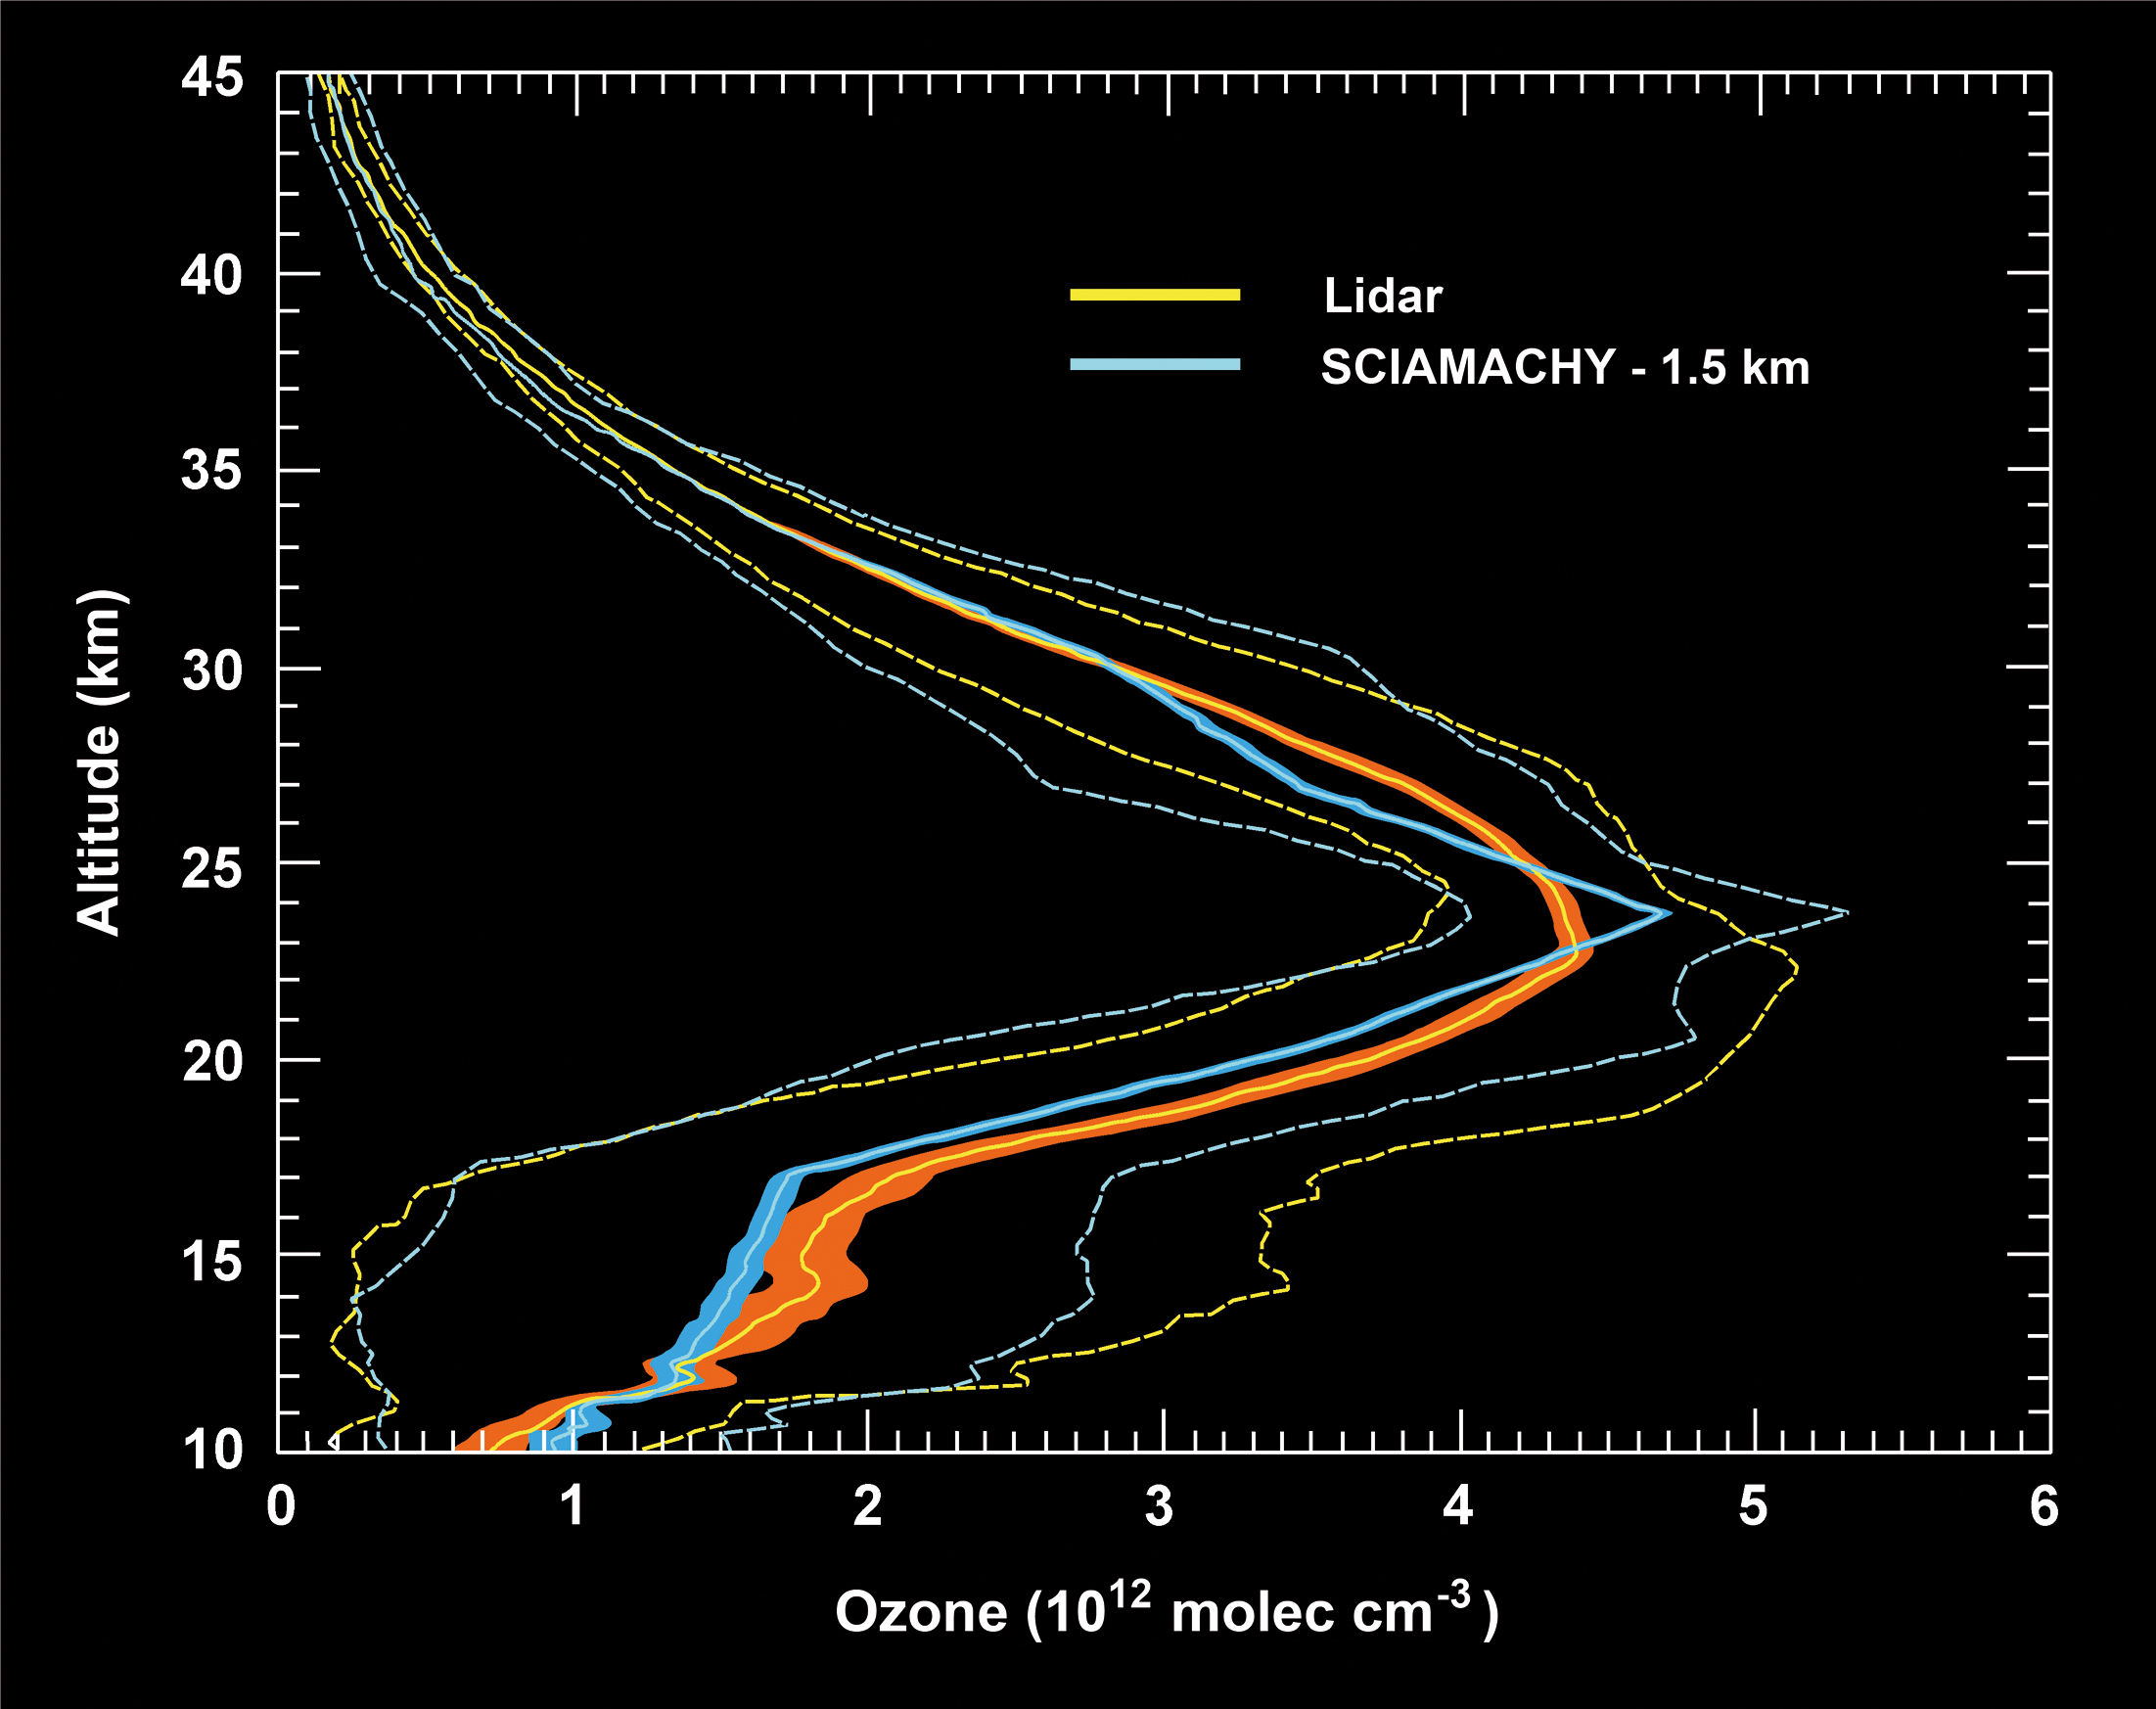
| Fig. 9-12 | Averaged
O3 profiles with their standard deviations (dashed lines) and errors (shaded areas) for 145 collocated
measurements from SCIAMACHY (blue) with 6 different lidars (yellow). An altitude shift of -1.5 km has been applied to the
SCIAMACHY data. The SCIAMACHY O3 profiles are retrieved by IUP-IFE, University of Bremen. (image: Brinksma et al. 2006) |
|
Page generated 26 March 2007