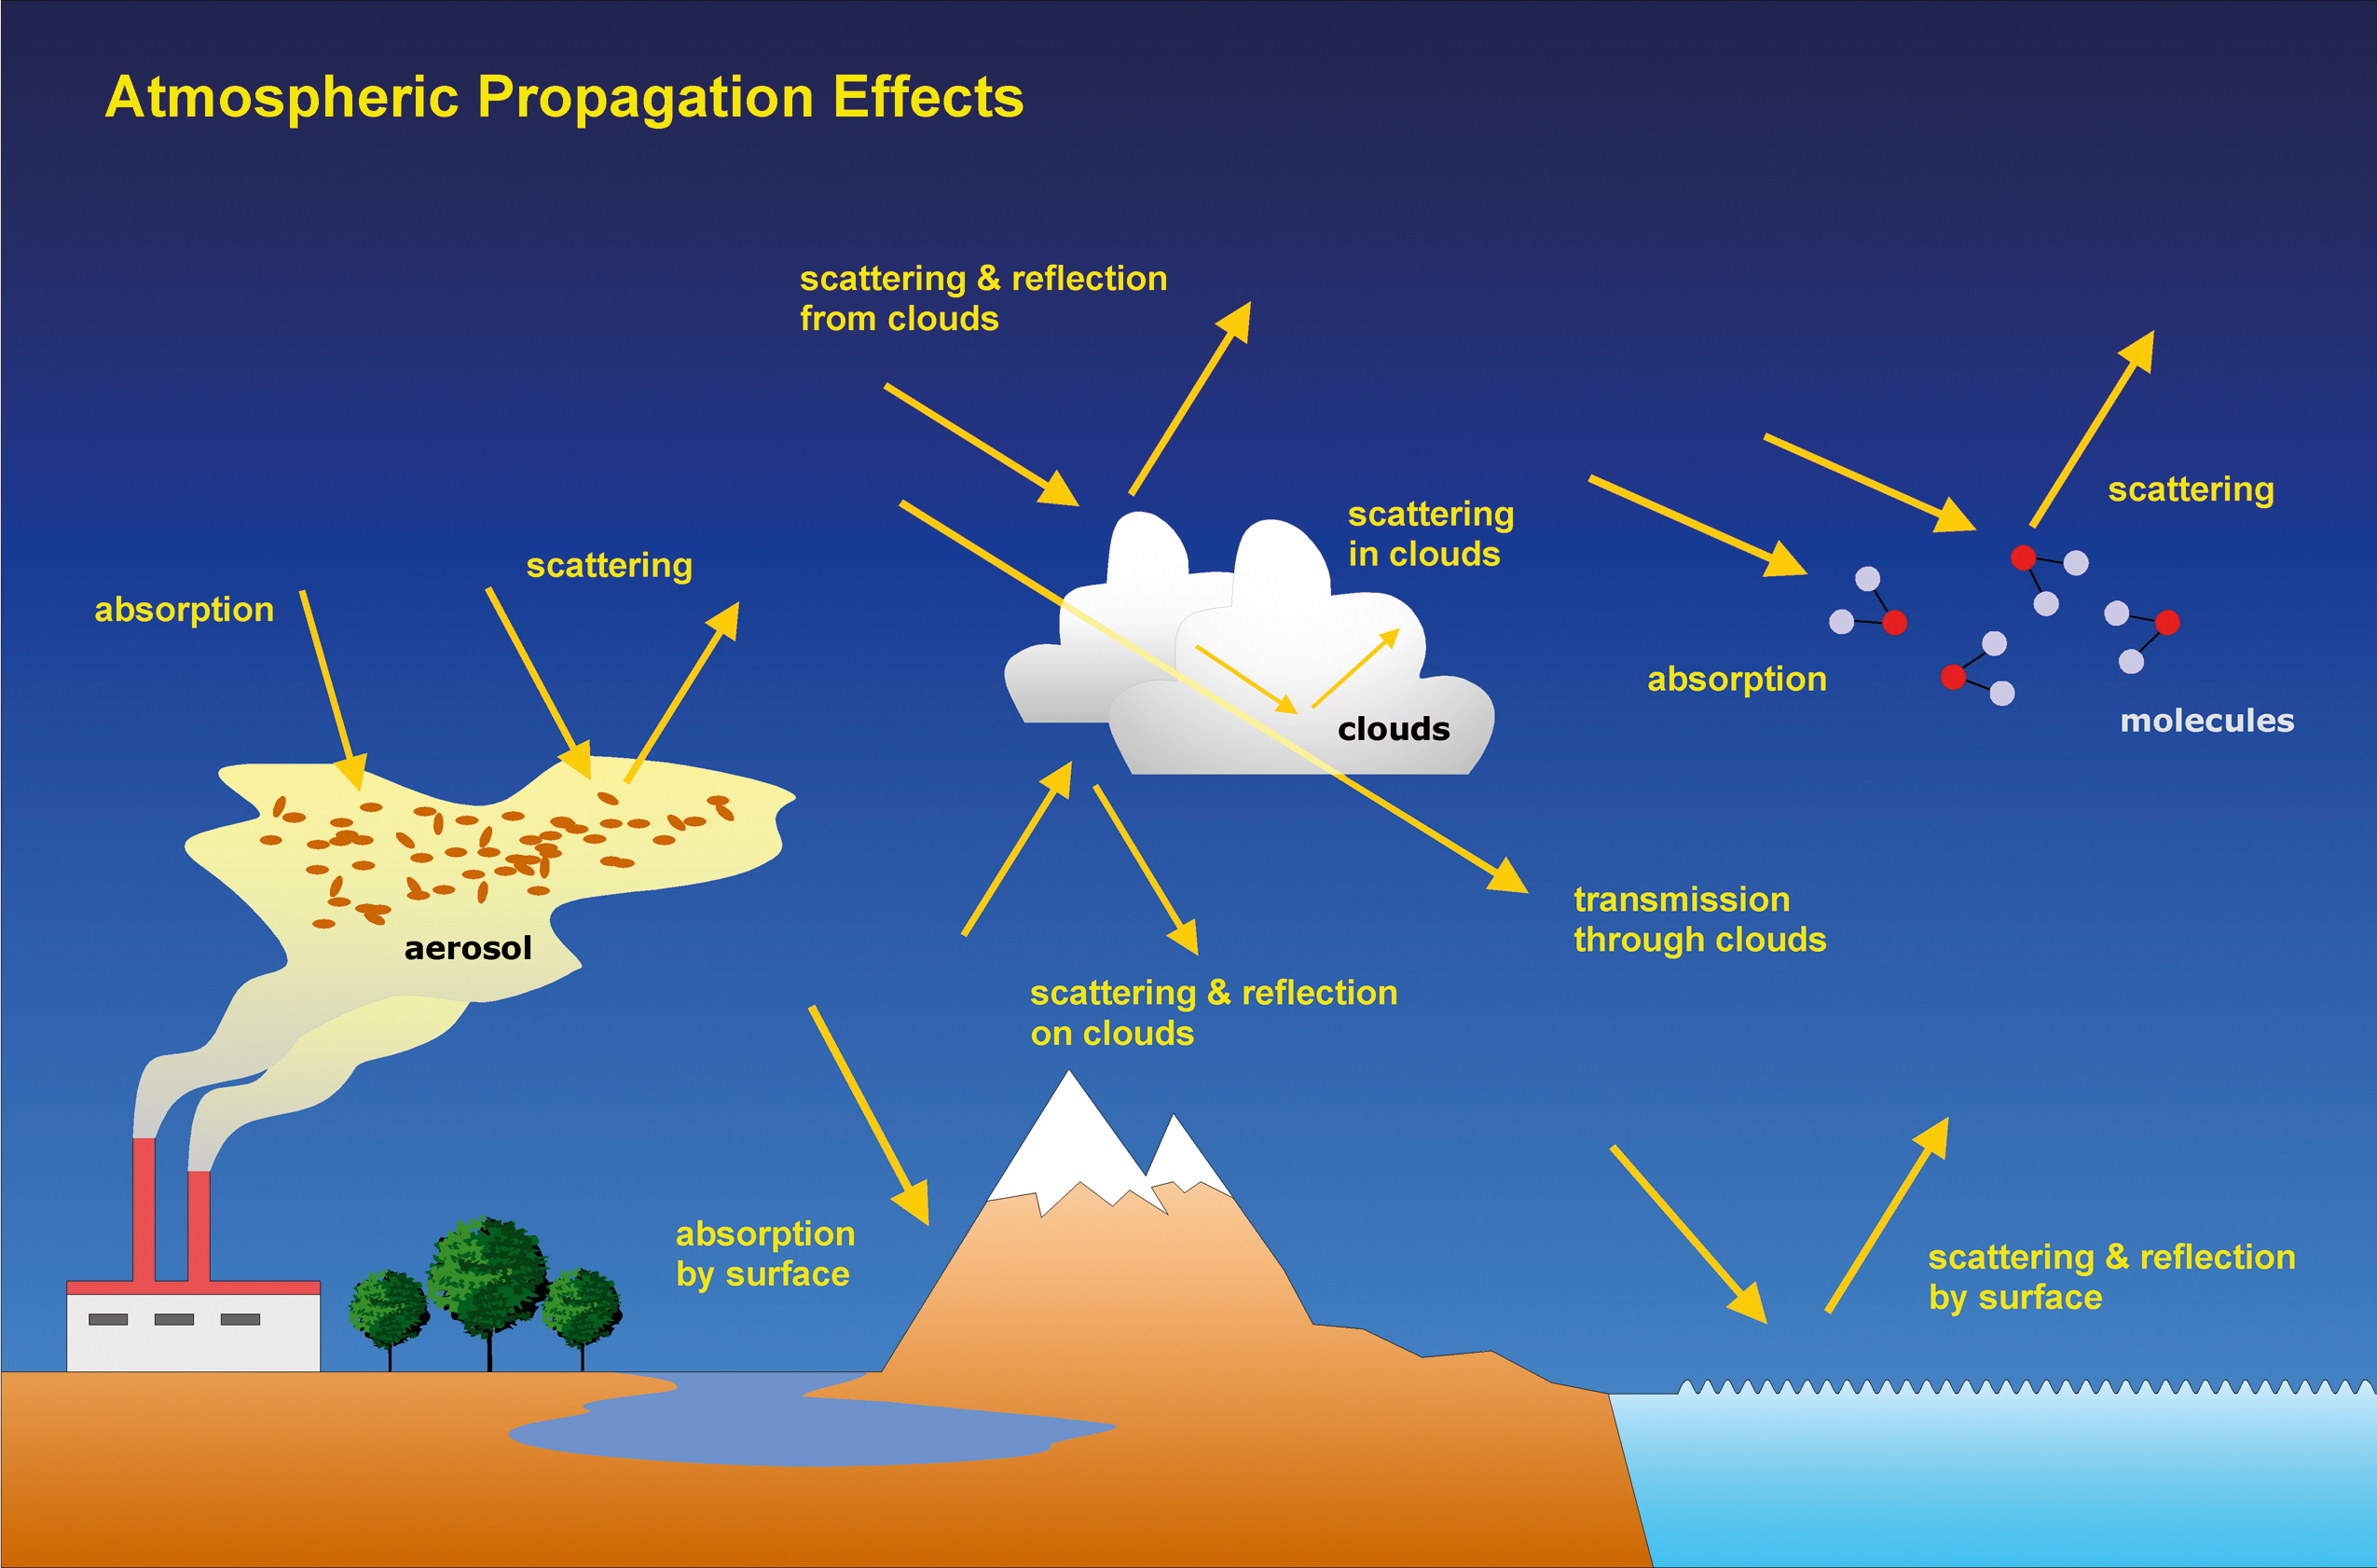
| Fig. 7-1 |
Scheme of the relevant interactions
of solar light with the Earth's atmosphere and surface. (graphics: DLR-IMF) |
|
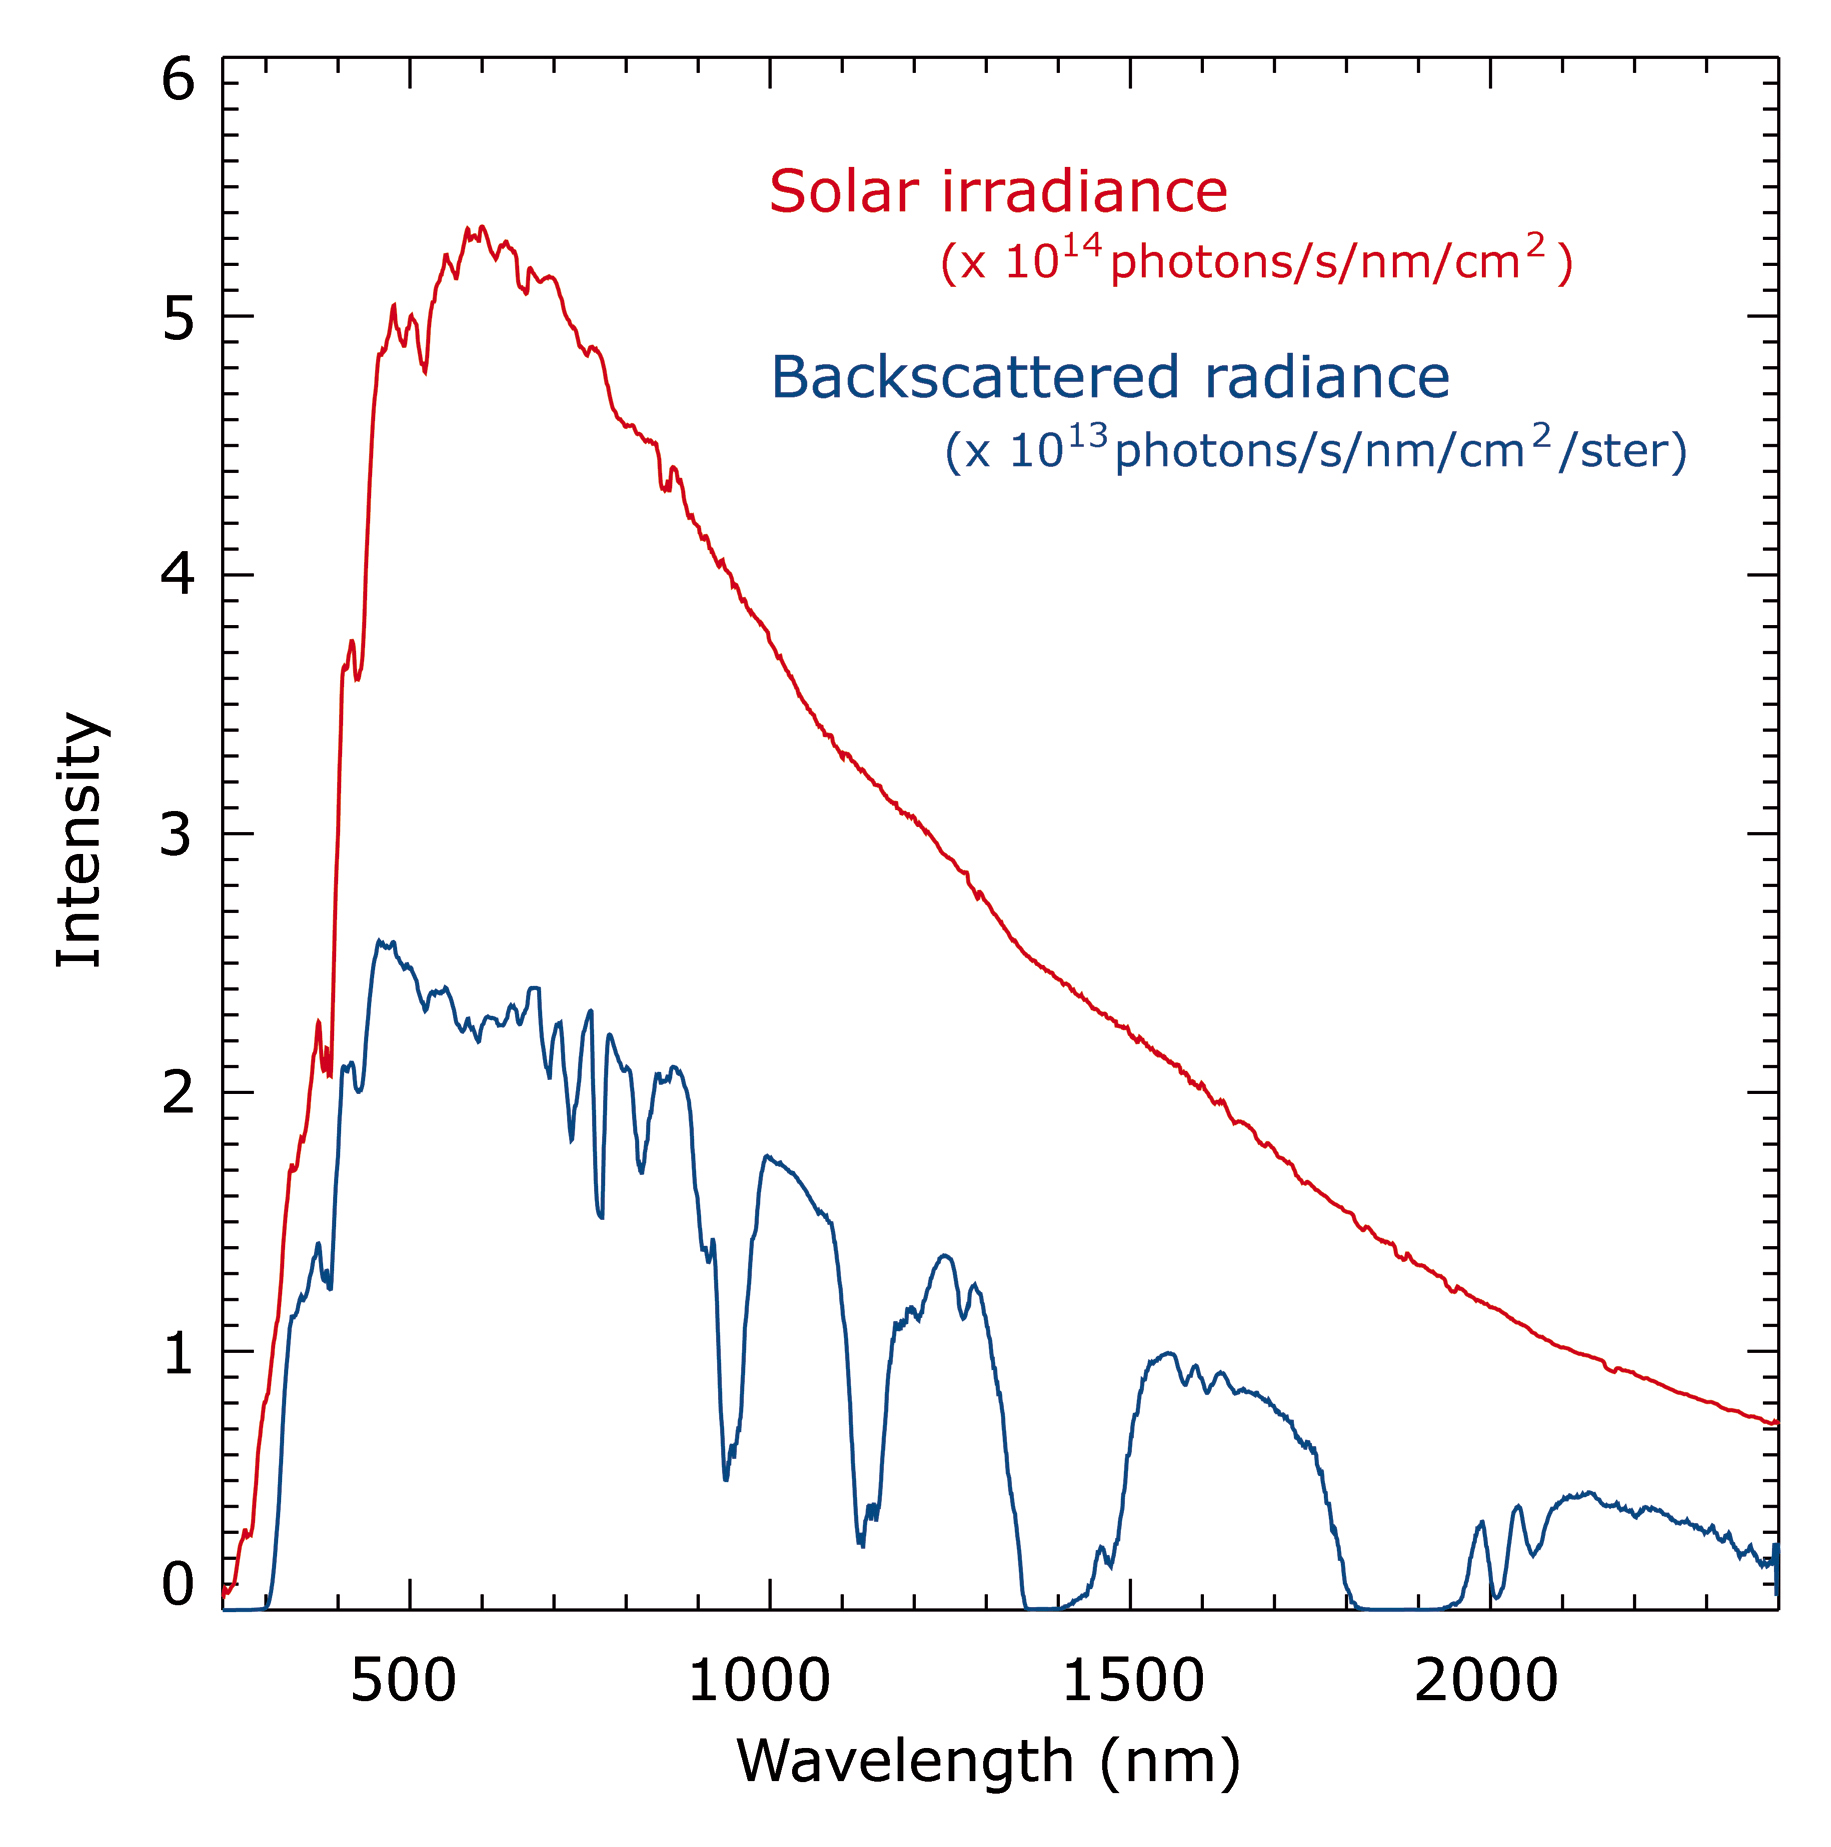
| Fig. 7-2 | The
solar irradiance spectrum (red) and Earth radiance spectrum (blue) with a shape modified by absorption
of trace gases and scattering in the atmosphere. (graphics: IUP-IFE, University of Bremen) |
|
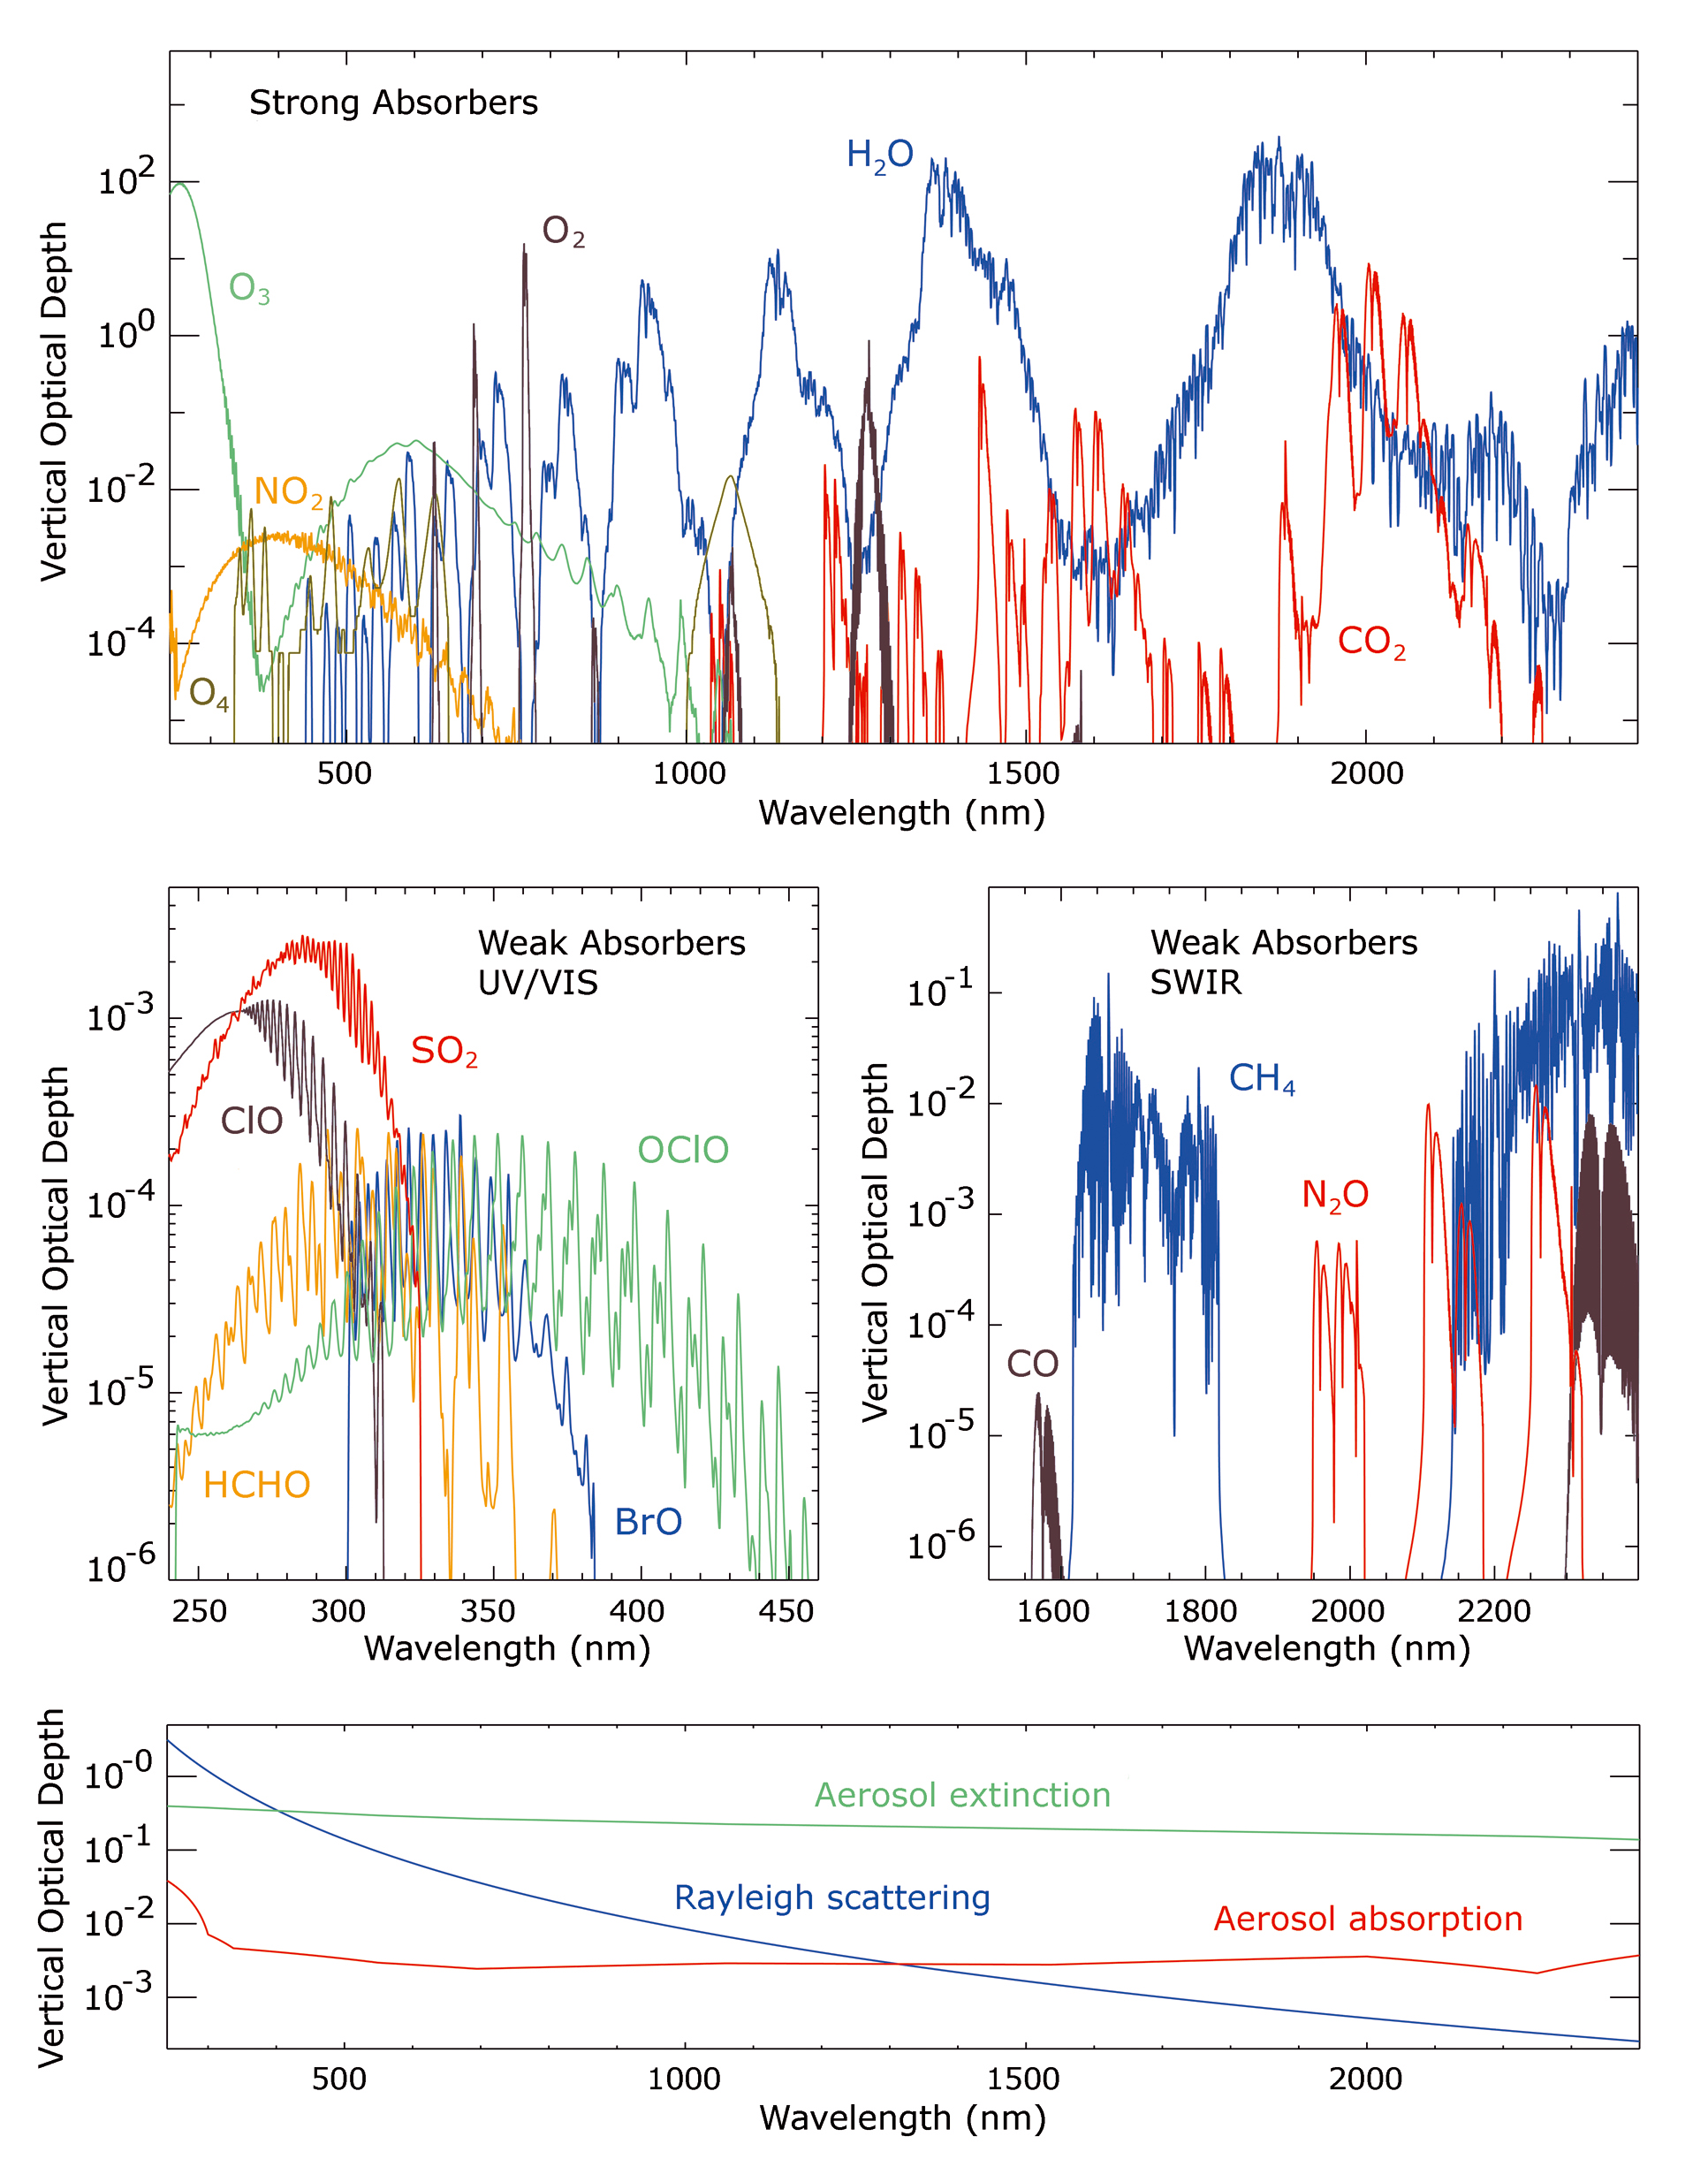
| Fig. 7-3 | Simulated
vertical optical depth of the targeted constituents to be observed at 55° N around 10 a.m. The
strong absorbers are plotted in the upper part and the relevant weak absorbers in the
middle part. In the lower part the vertical optical depth due to Rayleigh scattering,
aerosol extinction and absorption is given. Note the large dynamic
range of the differential absorption structures used for retrieval of the constituents. (graphics: IUP-IFE,
University of Bremen) |
|
| Fig. 7-4 | The
main steps of the DOAS retrieval. For further
details see the text. (graphics: IUP-IFE, University of Bremen) |

|
| Fig. 7-5 | Typical
SCIAMACHY NO2 fit results from a measurement over a polluted area in China on January 15th,
2006. The red line is the scaled NO2 laboratory cross-section, the dashed blue line the result of the fit after subtraction
of all contributions with the exception of NO2. (graphics: IUP-IFE, University of Bremen) |
 |
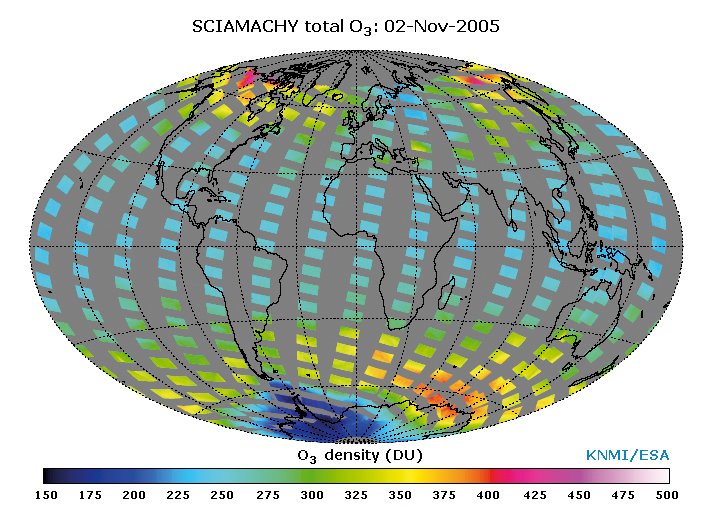
| Fig. 7-6 | One
day of total ozone densities obtained with the TOSOMI algorithm. (image: KNMI/ESA ) |
 |
| Fig. 7-7 | Earth
reflectance spectra (sun normalised intensity) for various cloud
and surface conditions. The inset shows the variation in the reflectance spectrum
due to changes in the thermodynamic state of water from liquid water to ice. The
large difference in the reflectance spectrum around 1600 nm is used to derive
information on the thermodynamical state of water in clouds. (graphics: IUP-IFE,
University of Bremen) |

|
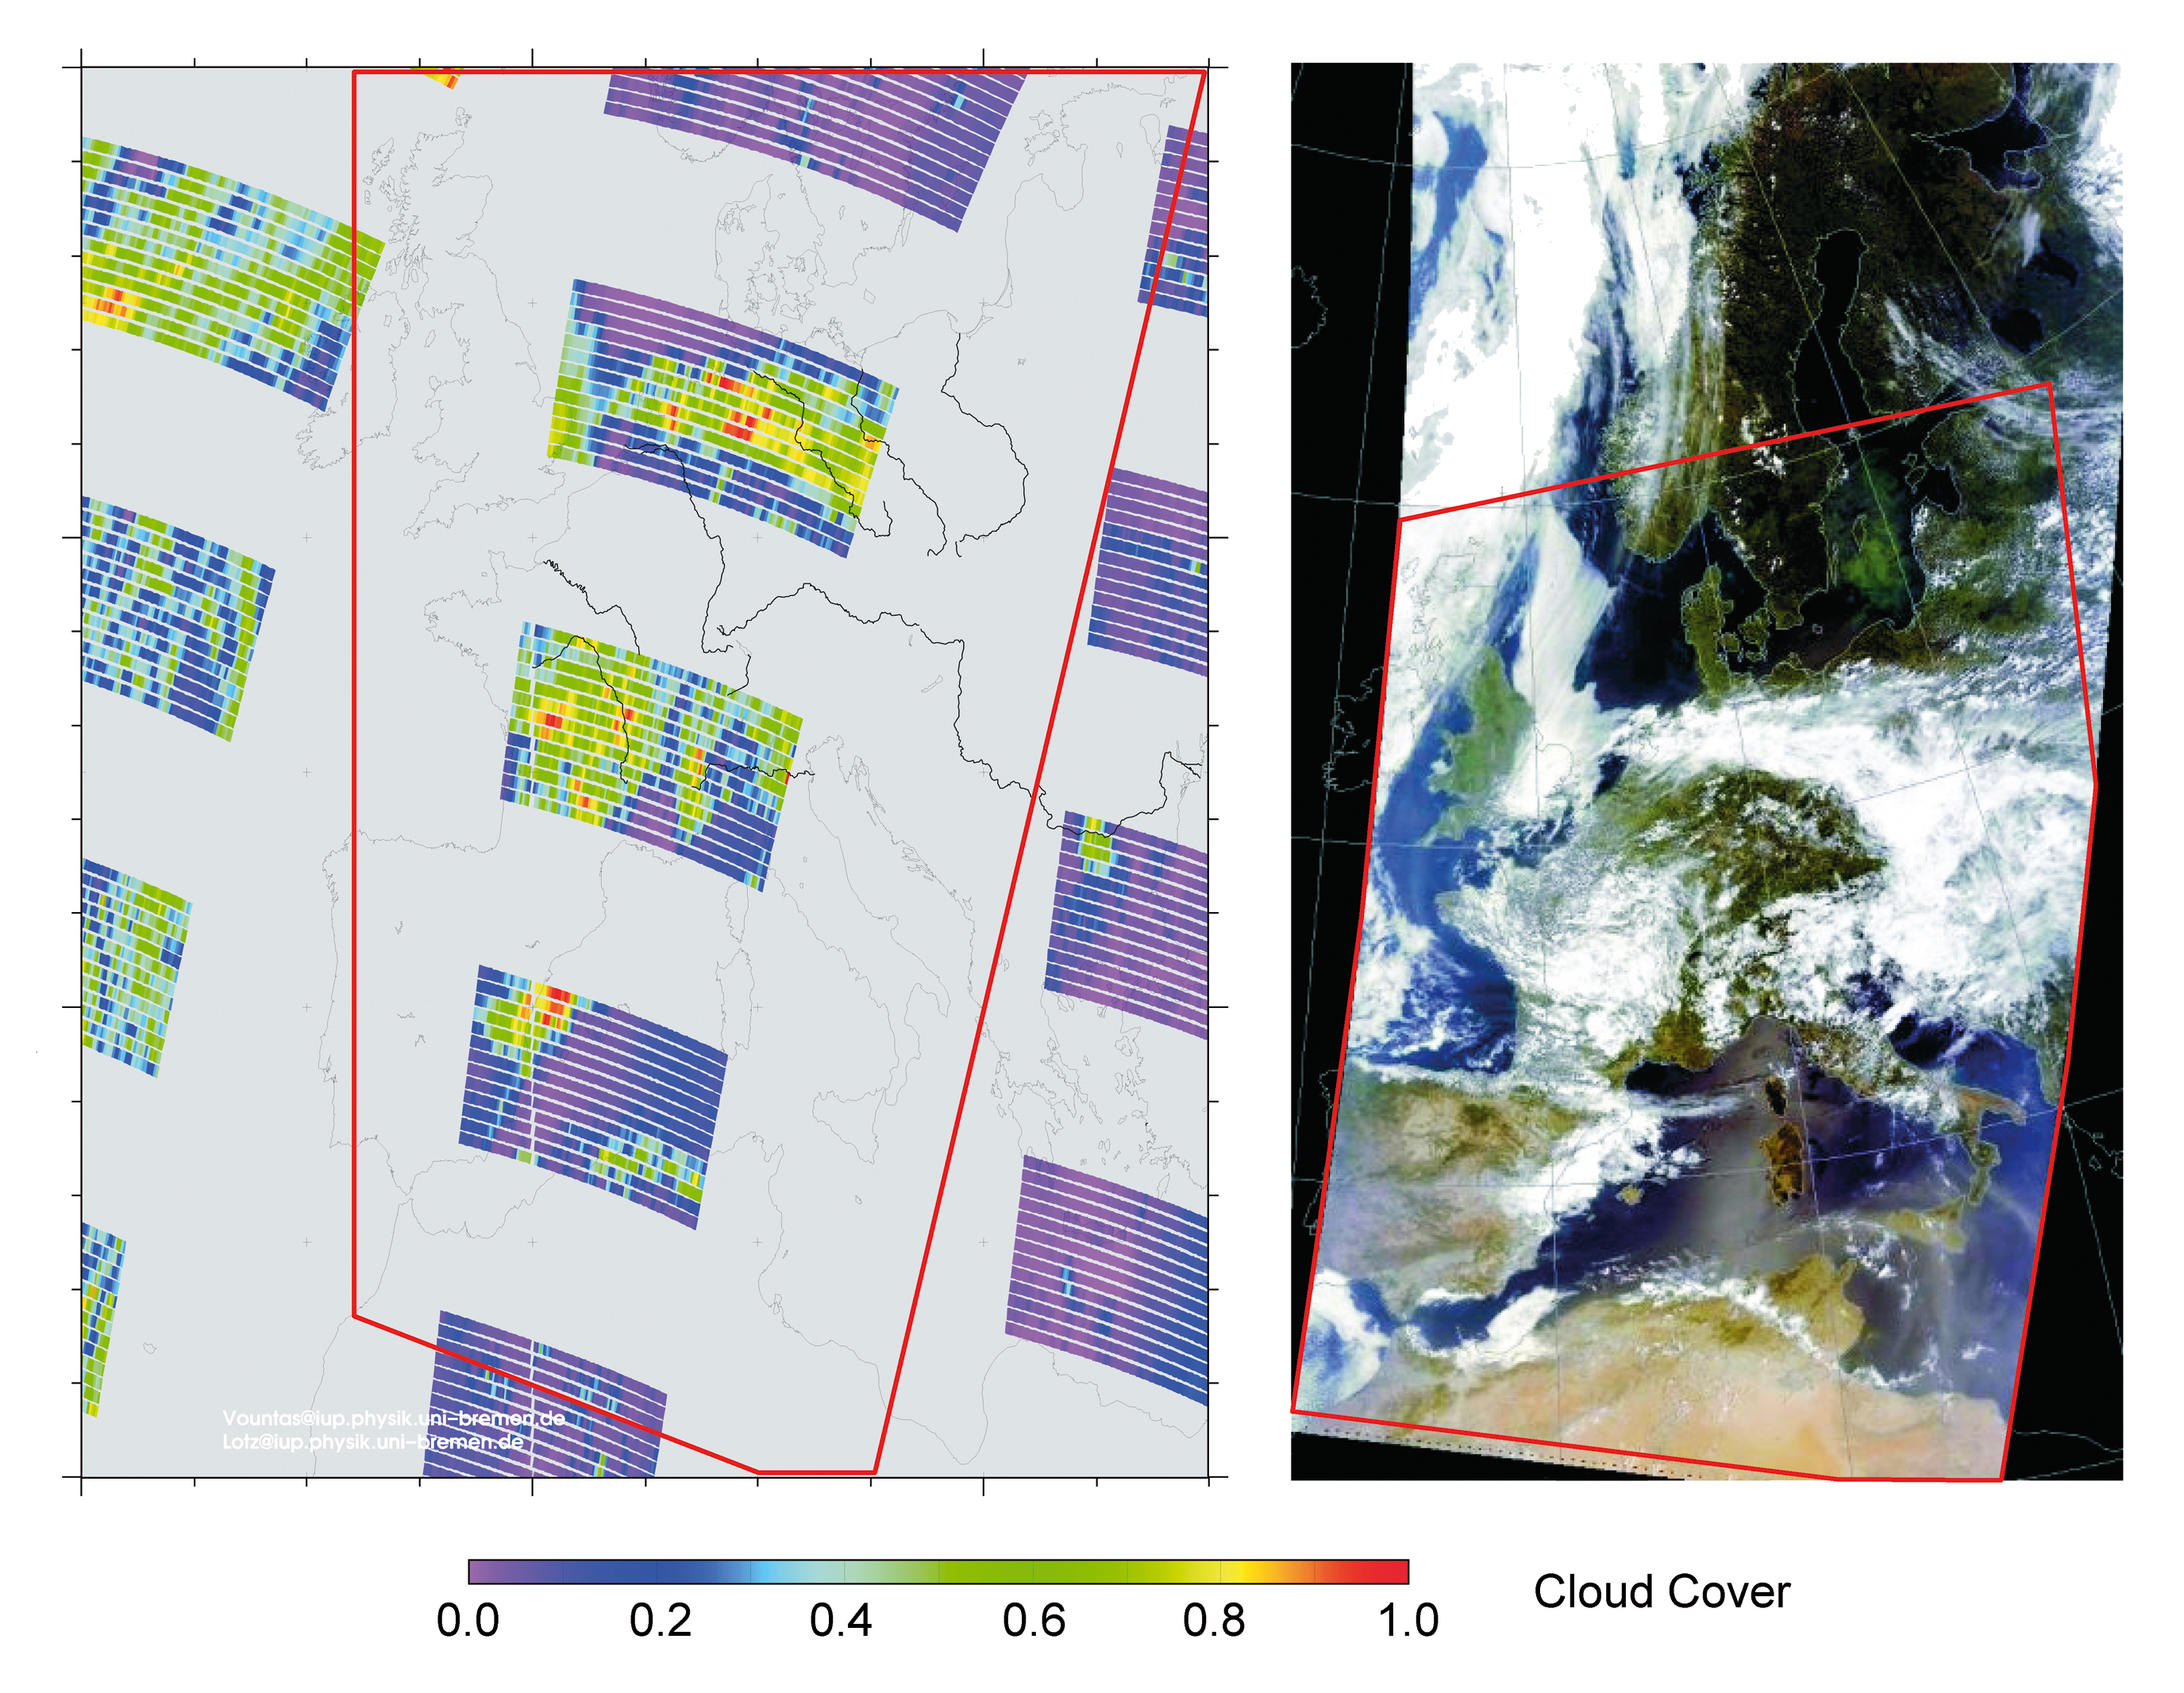
| Fig. 7-8 | Clouds
over Europe on July 9th, 2005. Cloud coverage as seen in a RGB composite
(right) from MODIS on-board TERRA and cloud fraction (left) determined
with OCRA using SCIAMACHY PMD data (images: IUP-IFE, University of Bremen
and Dundee Satellite Receiving Station) |
 |
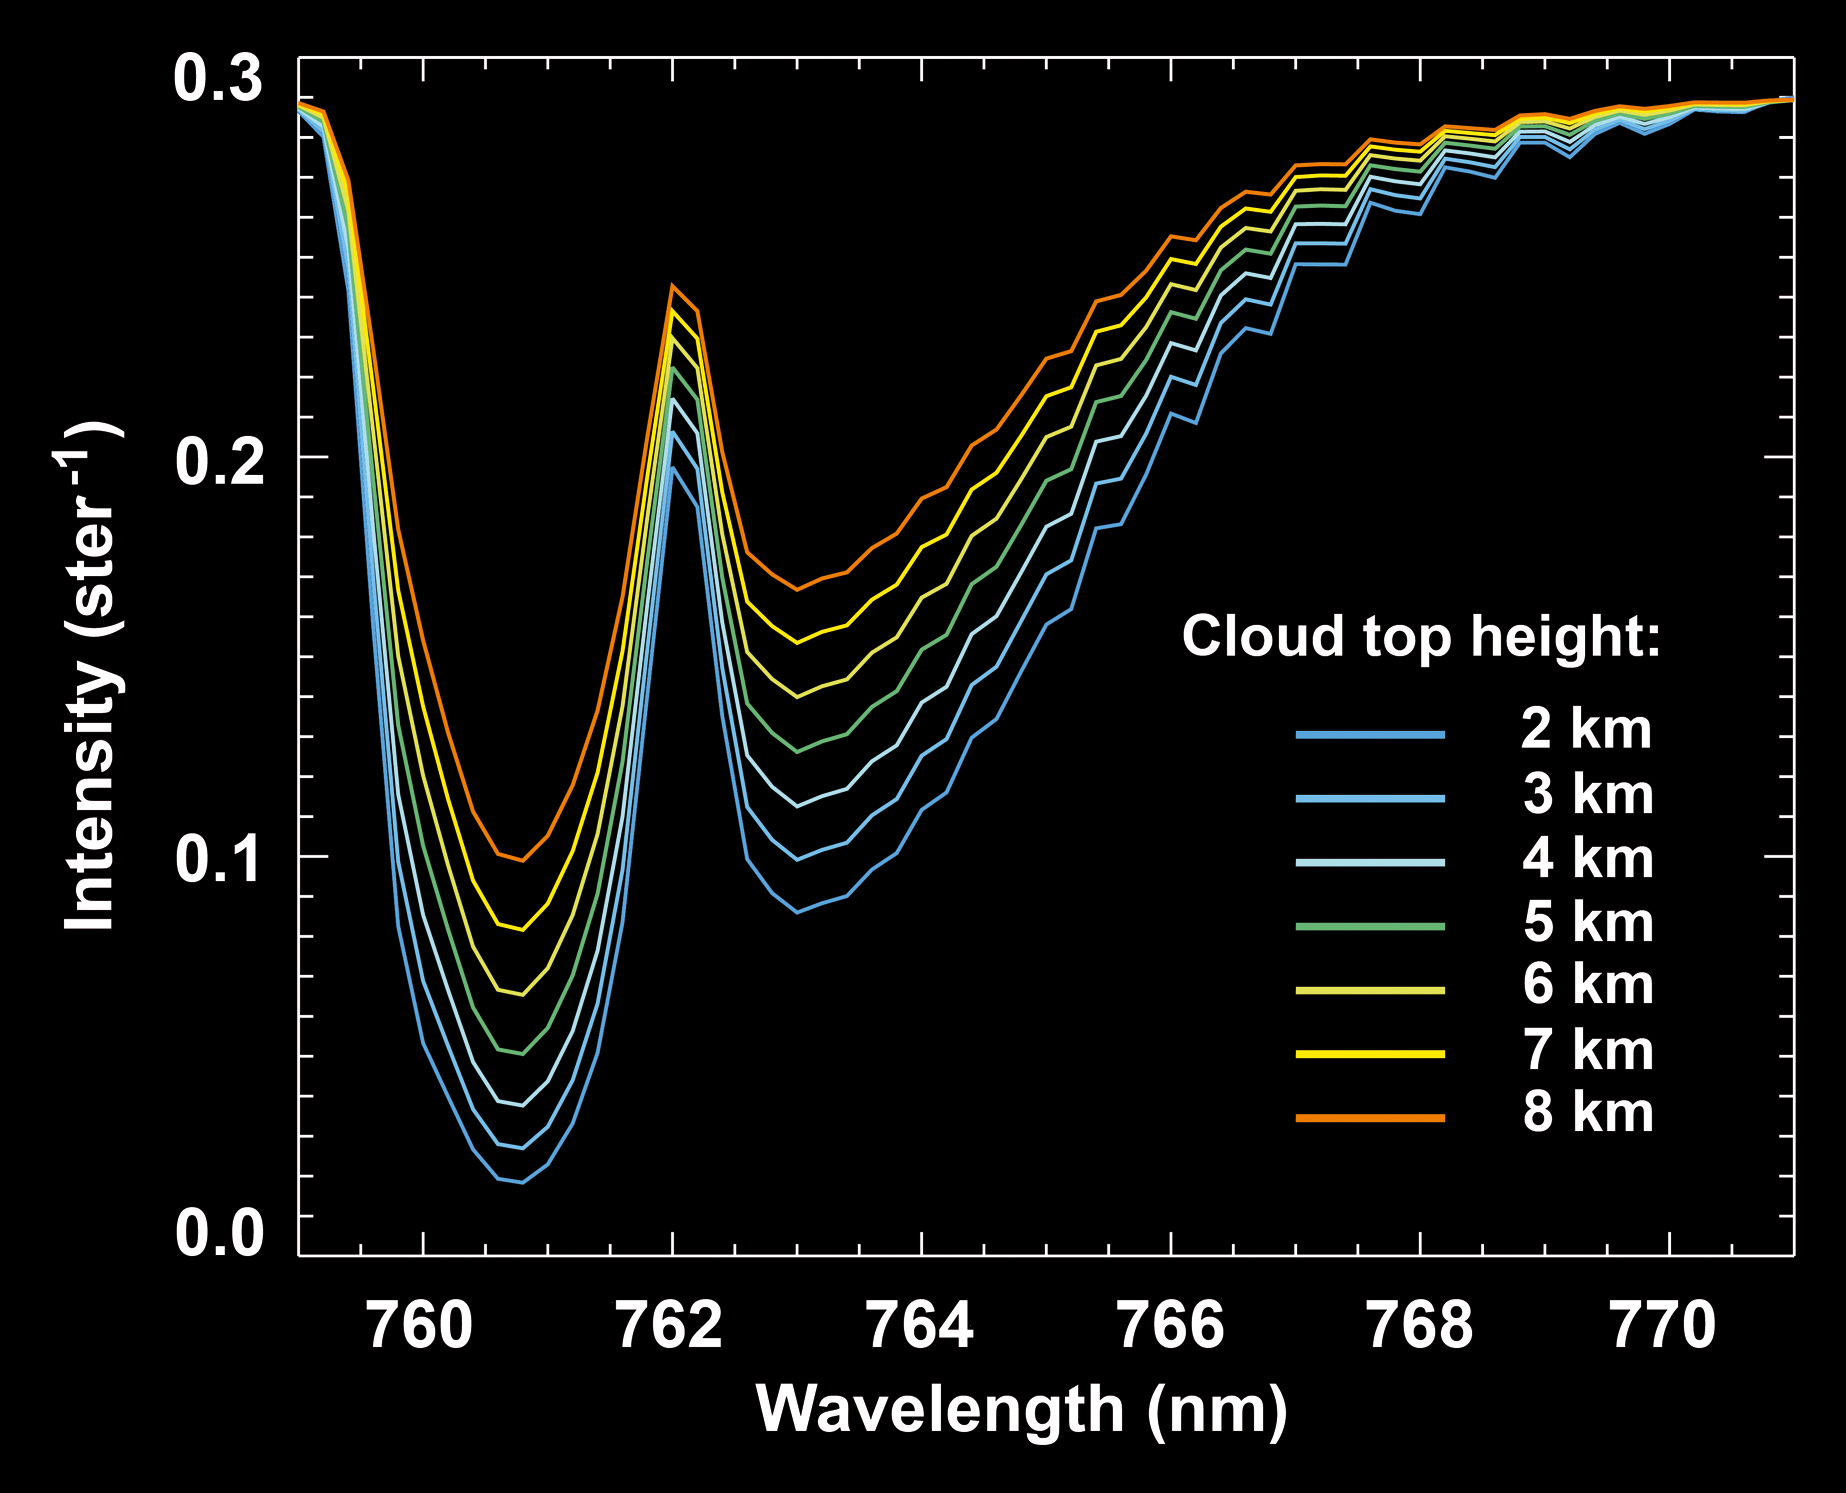
| Fig. 7-9 | The
top-of-atmosphere reflectance in the O2 A-band as a function
of cloud top height. (graphics: IUP-IFE, University of Bremen) |
 |
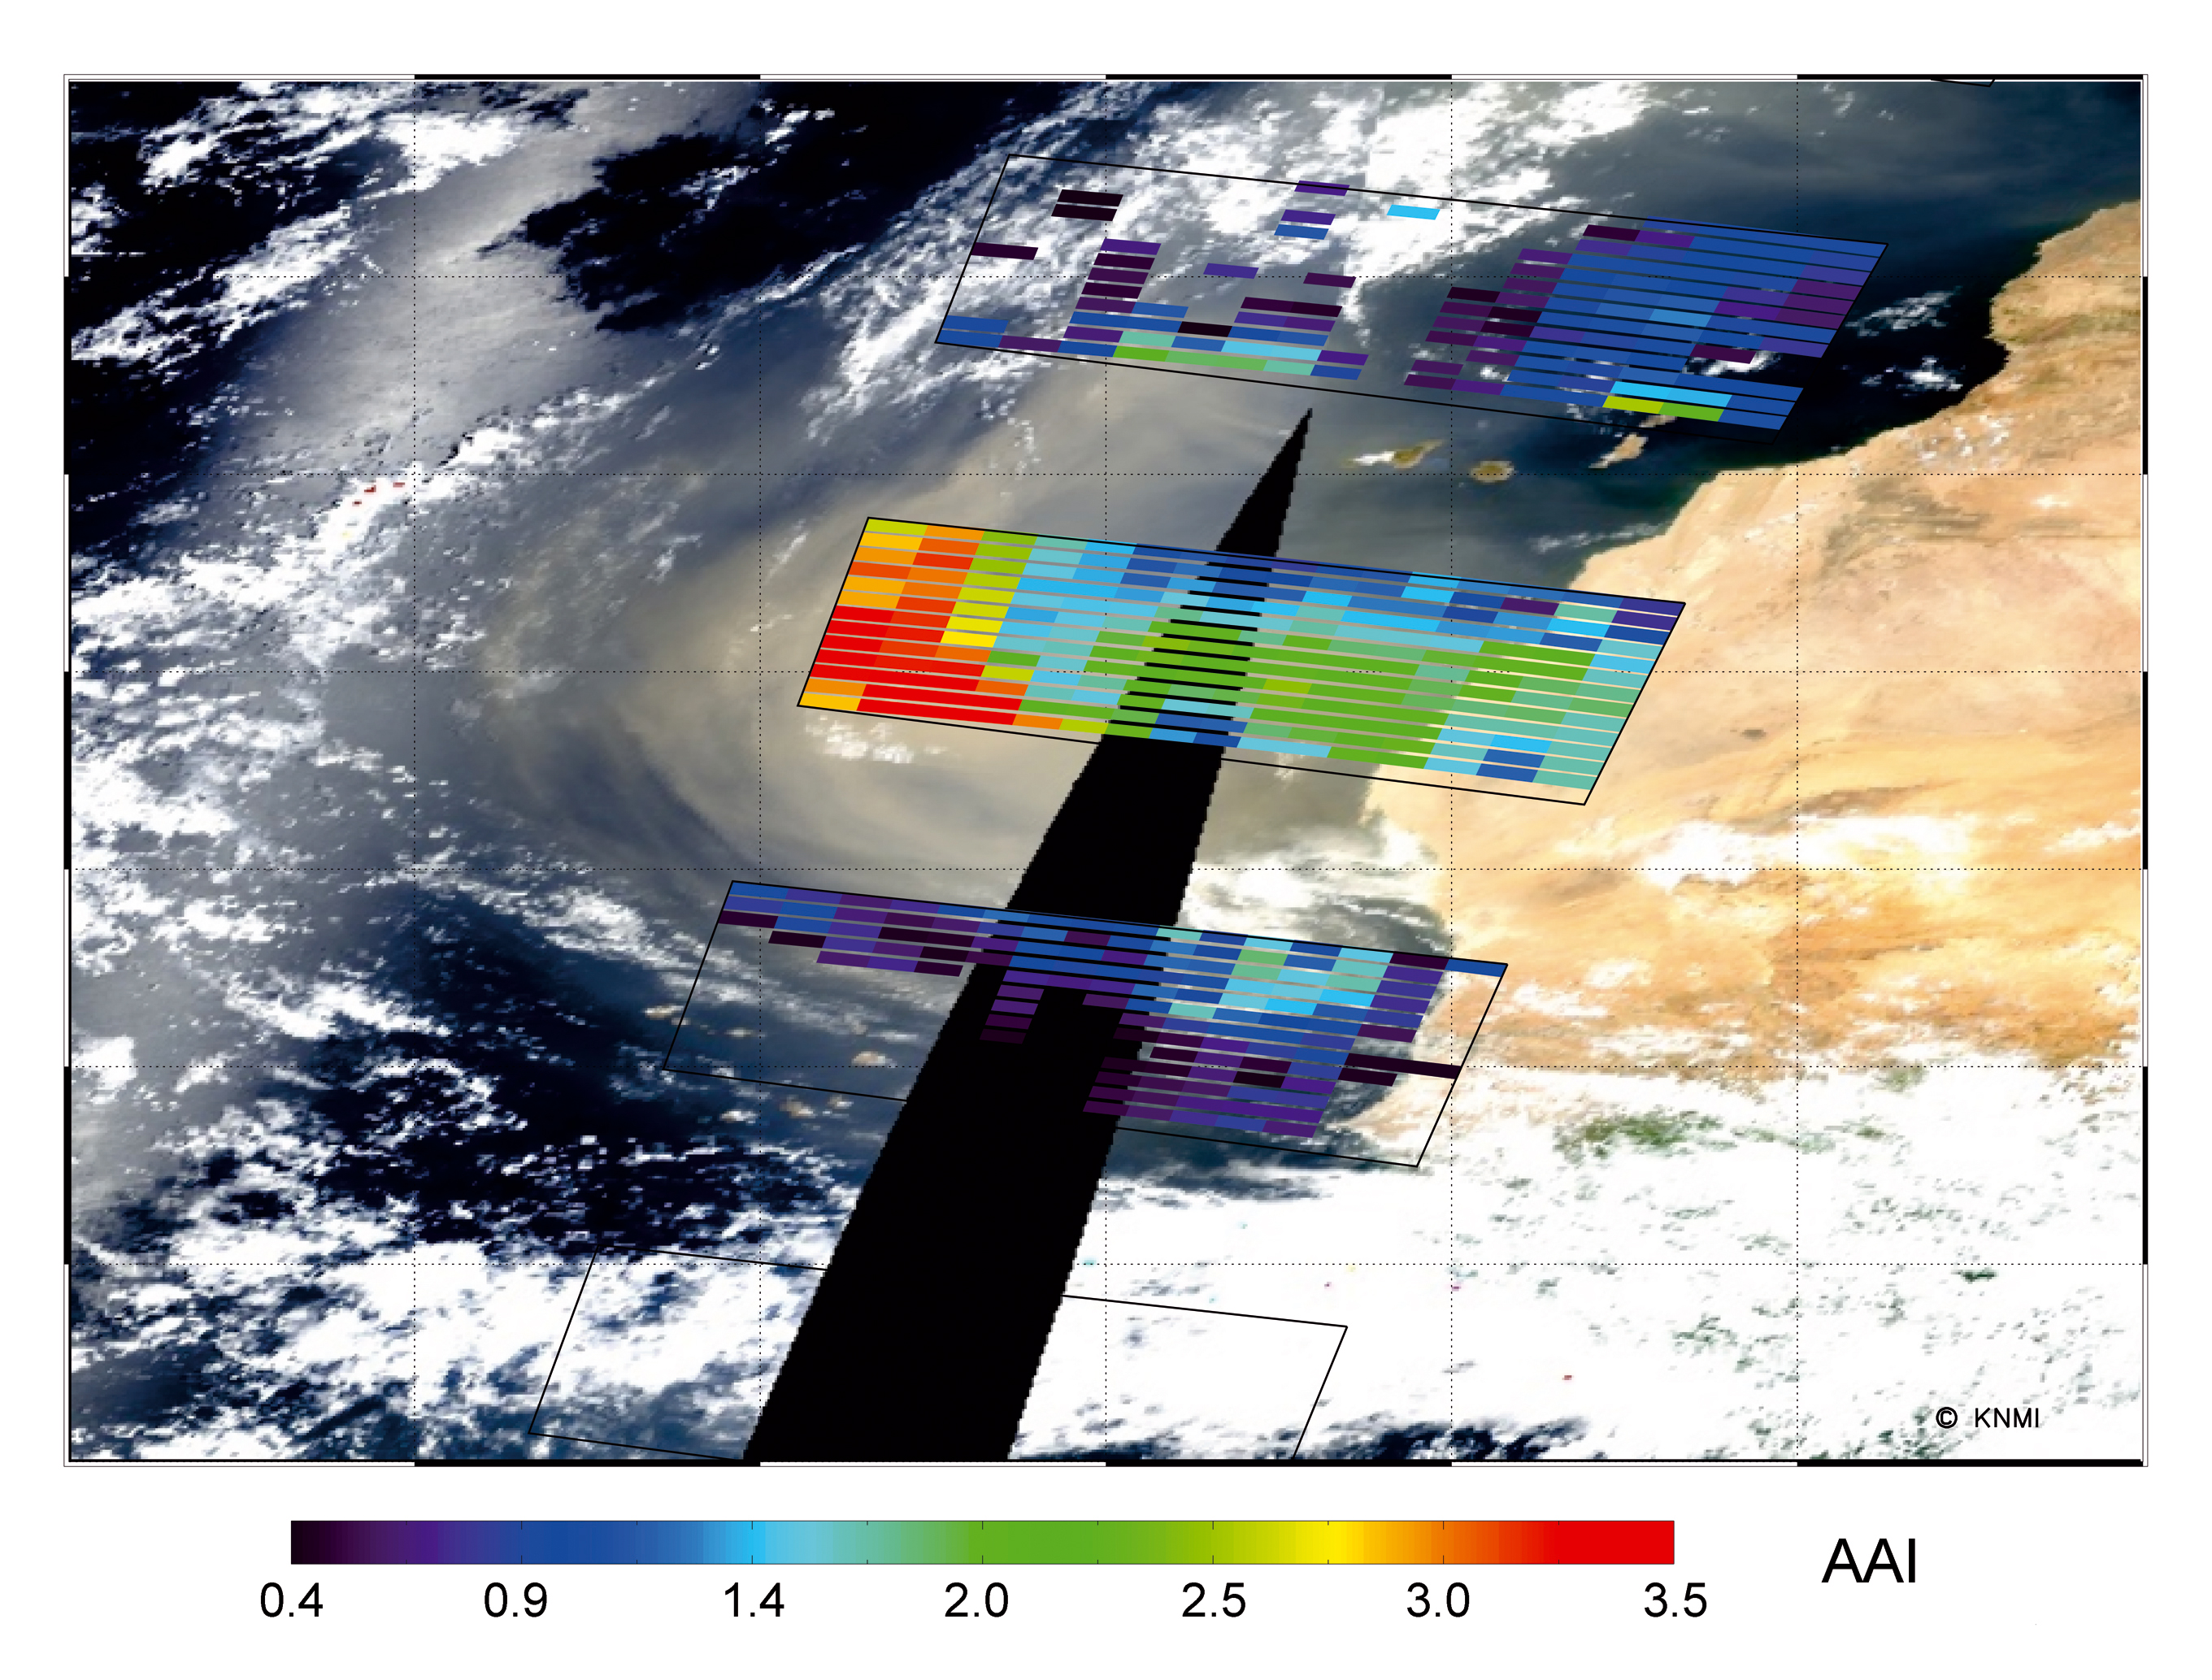
| Fig. 7-10 | Saharan
desert dust outbreak to the Atlantic on July 25th, 2004. Shown
are the SCIAMACHY AAI at 9:15 UTC of that day overlaid on a MODIS RGB picture,
acquired around 11:10 UTC (right side of the plot) and 12:50 UTC (left side of
the plot). High SCIAMACHY AAI values coincide with the dust plume, visible as a yellow
haze on the MODIS image. (image: M. de Graaf, KNMI) |
 |
| Fig. 7-11 | The
principle of inversion for the retrieval of geophysical parameters.
For further details see the text. (graphics: IUP-IFE, University of Bremen) |
 |
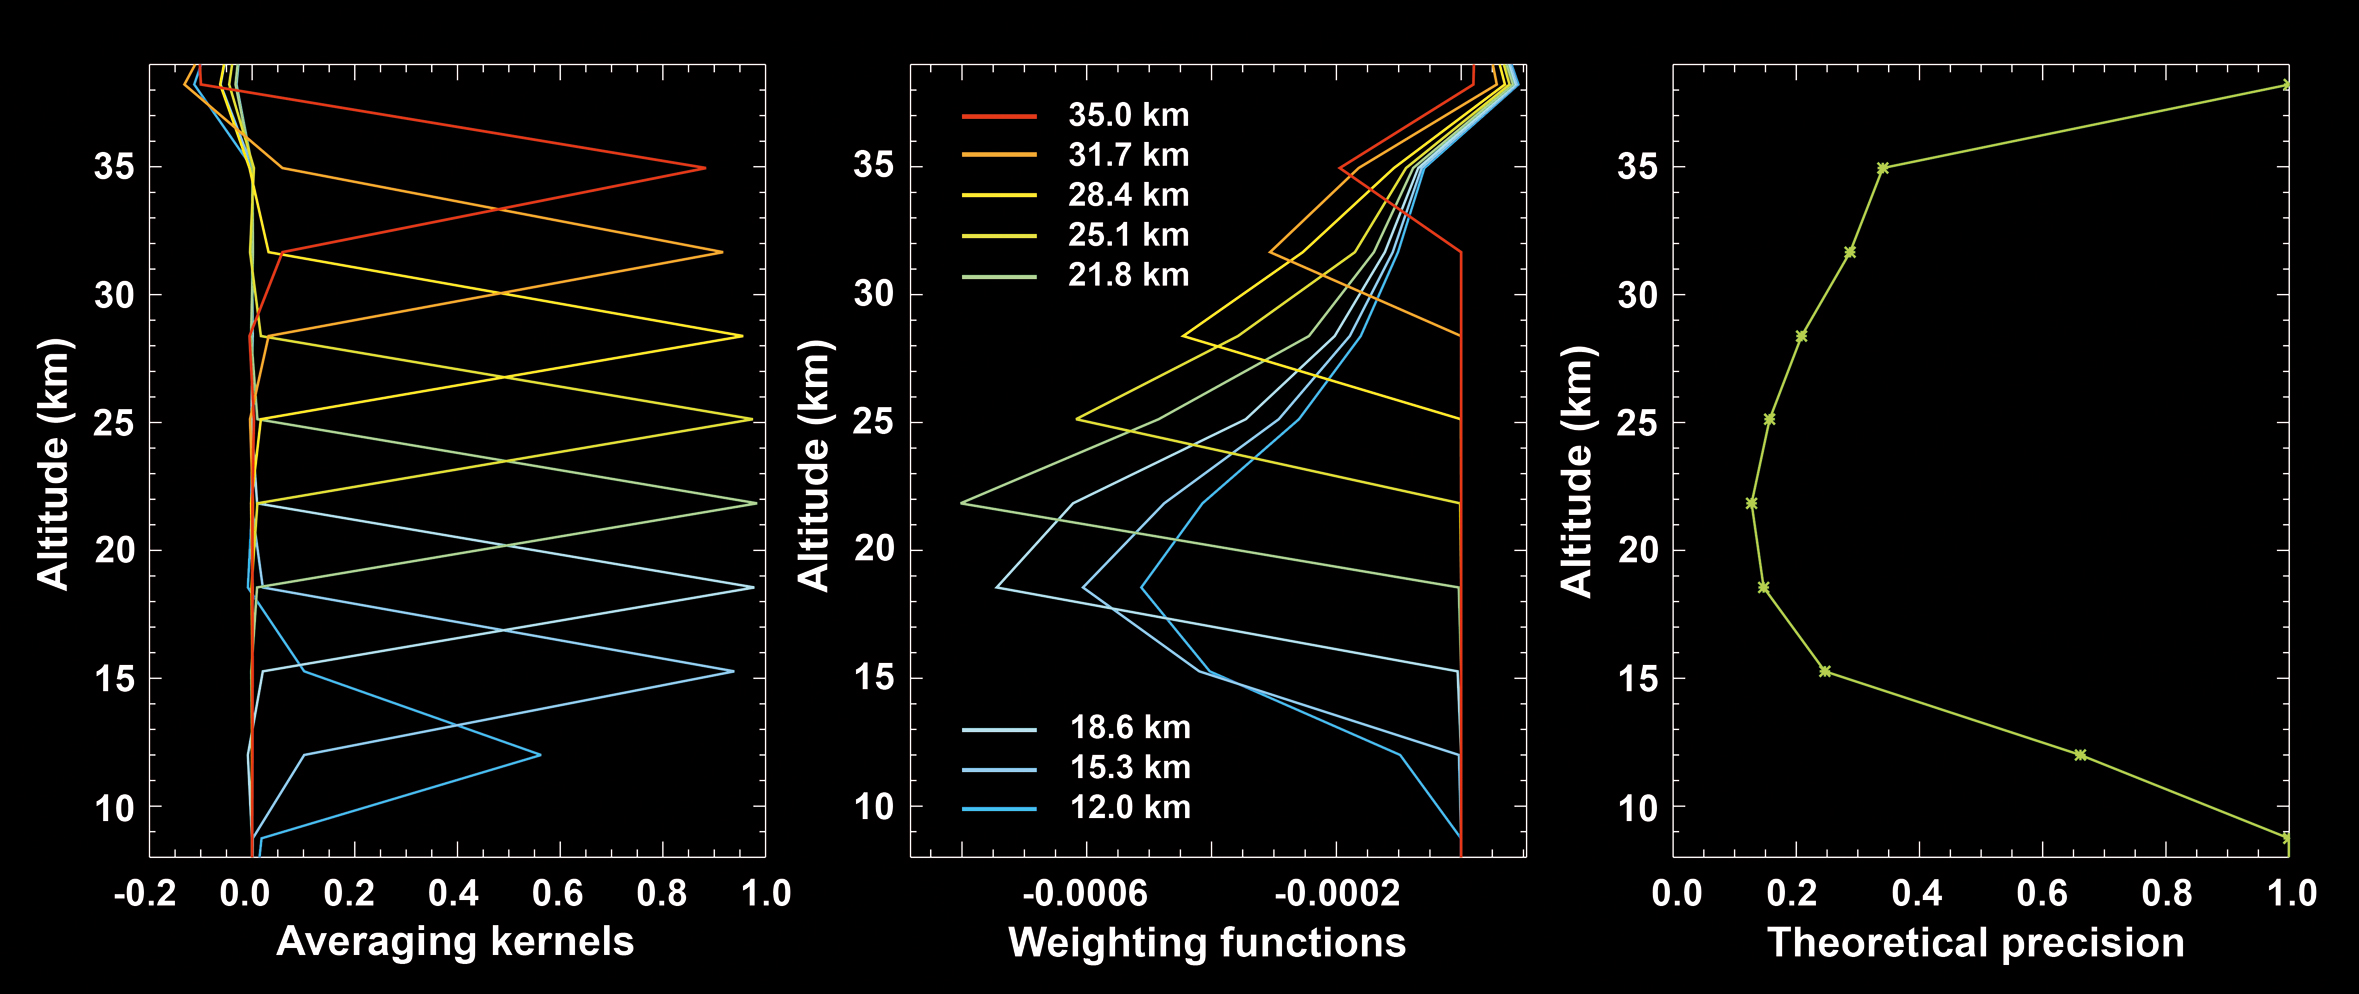
| Fig. 7-12 | Averaging
kernels (left), weighting functions at 338.6 nm (middle), and theoretical
precision (right) for BrO vertical profile retrievals from SCIAMACHY limb measurements. (graphics: IUP-IFE,
University of Bremen) |
|
| Fig. 7-13 | Mean
tropospheric NO2 vertical column densities over Europe as derived from SCIAMACHY
for August to October 2005 with the DLR-DFD assimilation approach. (image: T. Erbertseder, DLR-DFD) |

|
| Fig. 7-14 | A
forecasted North Pole view of the assimilated total ozone column field for
November 3rd, 2005 at 12:00 UTC based on SCIAMACHY data. (image: KNMI/ESA) |

|
Page generated 26 March 2007